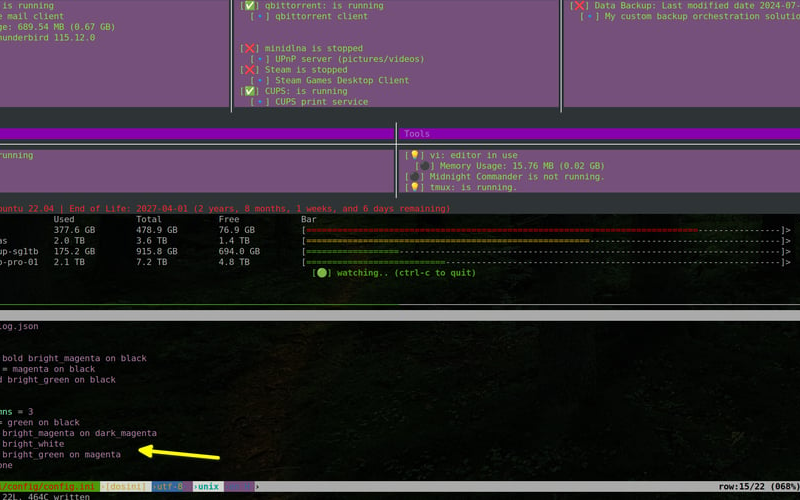
I previously introduced ‘hi’ – the Host Information tool to the world and described it’s base functionality. Later, I described how hi can be used to craft more complex notifications. In this article, I’ll describe some of the latest features implemented as part of the v0.4.5 pre-release.
Get ‘hi’ on GitHub: https://github.com/jbobbylopez/hi
Logging and State Management
One of the biggest features introduced is the use of the logging module to implement a logging facility to log every status change event detected by the ‘hi’ tool. State is captured as a JSON file, which is then compared against the current state of each check. If there is a difference, a log is written, and the last state is updated with the current state information.
State file example
➤ cat state.json
{
    "Systems": "FAIL",
    "ExpressVPN": "SUCCESS",
    "KeepassXC": "FAIL",
    "sshd": "SUCCESS",
    "signal-desktop": "FAIL",
    "Dropbox": "SUCCESS",
    "Galaxy S20 (sshfs)": "FAIL",
    "vdc2022nas": "SUCCESS",
    "wdred-8tb-pro-01": "SUCCESS",
    "Apache NiFi": "FAIL",
    "Open WebUI": "SUCCESS",
    "Thunderbird": "SUCCESS",
    "qbittorrent": "SUCCESS",
    "minidlna": "FAIL",
    "Steam": "FAIL",
    "CUPS": "SUCCESS",
    "Data Backup": "SUCCESS",
    "dockerd": "SUCCESS",
    "vi": "SUCCESS",
    "Midnight Commander": "FAIL",
    "tmux": "SUCCESS"
}
‘hi’ Logging Functionality
Log files are written in JSONL (JSON Lines) format, to make it easy to consume by other upstream log and API analytics and monitoring tools.
Tools such as Logstash, Graylog, Nagios, Zabbix, Splunk, Kibana, Datadog, and so on can easily ingest JSONL formatted logs, which makes it easy for these tools to parse and index the log data to generate simple or complex reports and notifications as required.
Log file example
➤ tail hi_log.json
{"timestamp": "2024-07-20T21:26:15.546248Z", "level": "INFO", "message": "vi state changed from SUCCESS to FAIL", "check_name": "vi", "previous_state": "SUCCESS", "new_state": "FAIL"}
{"timestamp": "2024-07-20T21:27:38.308707Z", "level": "INFO", "message": "sshd state changed from SUCCESS to FAIL", "check_name": "sshd", "previous_state": "SUCCESS", "new_state": "FAIL"}
Logs are only written when there is a status change for any of the checks being monitored.
Logging can be enabled in the config.ini file.
config/config.ini example
 [Paths]
 checks_file = config/checks.yml
 log_file = hi_log.json

 [Report]
 header_style = bold bright_magenta on black
 hostname_style = magenta on black
 ip_style = bold bright_green on black

 [Tables]
 number_of_columns = 3
 default_style = green on black
 header_style = bright_green
 border_style = bright_white
 column_style = bright_magenta
 text_style = None

 [OS Bar]
 os_text_style = bright_red on black

 [Logging]
 enable_logging = true
Color Customization
Because, Why Not.
If you are going to use a terminal regularly, you want your tools to look good. Well, at least I do. Some tools offer minimal choices regarding terminal color and styling options. Some offer a lot of options but make it rather difficult to customize quickly.
I know my personal taste in terminal color and styling choices may not be for everyone. So, I decided to make the ‘hi’ tool output easily customizable.
Below are just some of the possibilties for display customization you now have with the ‘hi’ tool:
Magenta on Magenta Color Scheme
Green on Green Color Scheme
Green on Black Color Scheme
Blue and Black Color Scheme
Magenta on Black Color Scheme
Conclusion
With the new logging and state tracking capabilities, along with customizable color schemes, the ‘hi’ tool paves the way for further expansion, opening doors for integration with other command-line or API-oriented tools that utilize standard JSON formatted outputs.
I would love your feedback on this tool! There are always bugs to fix and features to add as outlined in our ROADMAP.md, but I can’t catch everything on my own. Please don’t hesitate to reach out via GitHub if you encounter any issues or have suggestions. Sometimes the fix is as simple as an update or clarification in the README.md, and I’m more than happy to address it.
Thanks for checking out ‘hi,’ the Host Information tool! Let’s make monitoring more efficient together.
Join the discussion and contribute on GitHub
This article is cross-posted from ‘hi’ shows its colors on thedevopsjoint.com.
Source link
lol


