analytics

Glue cross-account setup

Glue cross-account setup

This document will cover detailed steps on how to query glue DB catalog from Dremio in a cross-account setup using AWS Lake formation Use-caseAccount A - Dremio is deployed here and AWS Glue_DB_A is created and added as a source in Dremio Account B - AWS Glue_DB_B is created and data is located in the S3 bucket Customer wants to share Glue-DB B catalog with Glue-DB A and query the data located in account B from Dremio Setup Diagram Role of each of service in the given setup - Lake Formation - To create data mesh, simplify cross-account data sharing,…
Read More
Massively Scalable Processing & Massively Parallel Processing

Massively Scalable Processing & Massively Parallel Processing

Massively Scalable Processing Real-time processing systems designed to efficiently process large volumes of data in a distributed, massively scalable manner are known as massively scalable processing. Cloud-native solutions and distributed computing frameworks such as Hadoop and Spark are examples of such systems. Features of MSP Horizontal scalability Increasing the number of nodes (machines) to spread processing and storage over several systems is known as horizontal scalability. Parallelism Dividing work into manageable portions that are handled concurrently by several nodes. Fault tolerance Systems can gracefully bounce back from node outages or hardware malfunctions. Scalability Distributed data storage allows for scalability of…
Read More
Pipeline Analytics: Unlocking the Power of Data to Enhance Software Development

Pipeline Analytics: Unlocking the Power of Data to Enhance Software Development

In today’s fast-paced world of software development, speed and quality are paramount. Continuous Integration (CI) and Continuous Deployment (CD) pipelines automate the building, testing, and deployment of software, helping teams deliver faster and more reliably. However, as the complexity of development environments increases, ensuring the efficiency and reliability of these pipelines requires more than just automation—it requires pipeline analytics. What is Pipeline Analytics? Pipeline analytics is the practice of collecting, analyzing, and interpreting data from various stages of a CI/CD pipeline. By capturing key metrics such as build times, test results, and deployment success rates, teams can identify bottlenecks, optimize…
Read More
Unleashing Data Insights: Harnessing Amazon QuickSight Q’s Generative BI for Transformative Analytics

Unleashing Data Insights: Harnessing Amazon QuickSight Q’s Generative BI for Transformative Analytics

My company Baker Tilly Digital has leveraged Amazon’s QuickSight solution for a variety of internal and external analytics use cases. With continuous advancements in technology, Amazon recently made their Amazon Q product, a Generative AI solution, generally available in Amazon QuickSight. Amazon Q in QuickSight brings together the generative AI strengths of large language models (LLMs) from Amazon Bedrock with the proven models from QuickSight to create Generative BI experiences, reducing time to insights and accelerating data analysis.Some of the capabilities include 1) contextual answers with multi-visual Q&A2) insights with Executive Summaries3) ability to build visuals and calculations quickly using…
Read More
Quickstart Guide: Getting Started with Measurely

Quickstart Guide: Getting Started with Measurely

Welcome to Measurely! This guide will walk you through creating your first application, setting up your first metric, and sending data programmatically using our API. Let’s get started! Step 1: Create Your First Application Log in to the Measurely Dashboard:Head to Measurely Dashboard and log in using your preferred authentication method (GitHub, Google, etc.). Create an Application: Provide a name for your new application Add an image (optional) Click on the Create Application button. Step 2: Define Your First Metric Navigate to the Metrics Section: Within your application, click on Create Metric. Create a Metric: Step 3: Set Up Your…
Read More
BigQuery

BigQuery

BigQuery é um serviço de análise de dados altamente escalável e rápido fornecido pela Google Cloud. Ele é projetado para processar grandes volumes de dados em tempo real, facilitando a análise de dados estruturados e não estruturados. BigQuery usa SQL como sua linguagem principal para consultas, mas também oferece integrações com outras ferramentas de análise de dados, como Python, R, e interfaces de BI. Aqui está um guia passo a passo para começar com o BigQuery. 1. Configuração Inicial do BigQuery Antes de começar a usar o BigQuery, você precisa configurar um projeto no Google Cloud e ativar a API…
Read More
Revolutionizing the $27+ Billion Market with Conversational AI in Data Analytics

Revolutionizing the $27+ Billion Market with Conversational AI in Data Analytics

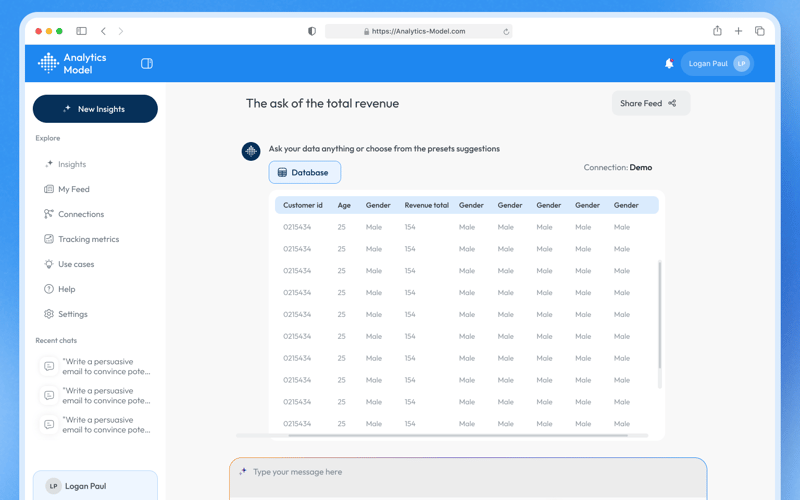
Analytics Model demonstration Video As the data analytics market expands beyond $27 billion, companies are seeking innovative solutions to unlock value from their data. Analytics Model is at the forefront of this revolution, leveraging conversational AI to make data insights more accessible and actionable. By blending AI-driven analysis with an intuitive, conversational interface, Analytics Model enables users of all technical backgrounds to extract insights, make informed decisions, and drive business growth. Conversational AI: The Future of Data Analytics Traditional data analytics platforms can be complex, requiring specialized skills to interpret data and extract insights. Analytics Model disrupts this paradigm by…
Read More
Unlocking the Power of Multimodal Data Analysis with LLMs and Python

Unlocking the Power of Multimodal Data Analysis with LLMs and Python

Introduction In today’s data-driven world, we no longer rely on a single type of data. From text and images to videos and audio, we are surrounded by multimodal data. This is where the magic of multimodal data analysis comes into play. By combining large language models (LLMs) with Python, you can unlock powerful insights hidden across different data types. Whether you’re analyzing social media posts, medical images, or financial records, LLMs, powered by Python, can revolutionize how you approach data integration. In this guide, we will take a deep dive into how you can master multimodal data analysis using LLMs…
Read More
Unlock Real-Time Cross-Platform Collaboration with Delta Sharing Tableau Connector

Unlock Real-Time Cross-Platform Collaboration with Delta Sharing Tableau Connector

Special thanks to Kevin Glover, Martin Ko, Kuber Sharma and the team at Tableau for their valuable insights and contributions to this blog.Organizations need to share data with their partners, customers, and suppliers to foster collaboration and drive innovation. However, the reality of accessing, sharing and securing these diverse and often siloed datasets across data platforms often creates friction and complexity, blocking collaboration. To address this, Databricks and the Linux Foundation introduced Delta Sharing, the first open source protocol for platform-agnostic data sharing, enabling organizations to securely extend collaboration beyond their data platforms and organizational boundaries.Delivering on the original promise…
Read More
Simple but rarely used analytical methods that will improve the performance of your advertising campaign

Simple but rarely used analytical methods that will improve the performance of your advertising campaign

Digital analytics of advertising channels is an integral part of working on marketing campaigns. One of the most effective approaches in analyzing advertising campaigns is the study of performance indicators across various segments. In practice, the following popular breakdowns are most commonly used: Analysis by advertising campaigns; By keywords and ad groups; By device type (smartphones, tablets, computers); By geography (cities and countries); By demographic characteristics (gender and age). As a rule, during the analysis, the specialist divides the traffic among segments and evaluates the difference in cost per lead (CPL) or cost per order (CPO). Then, appropriate adjustments are…
Read More
No widgets found. Go to Widget page and add the widget in Offcanvas Sidebar Widget Area.