Deephaven is rolling. The team is spending the summer focused on workflows for data scientists: Python pip installation, Jupyter integrations, upgraded table operations, and more real-time plotting capabilities. As fall arrives, we’ll begin releasing developer and application-focused features, like authentication hooks and authorization.
The complete 0.14.0 release notes can be found on GitHub.
Deephaven as a Python library
Deephaven is now available as a simple Python library, making it easy for you to launch it within your existing Python workflow and IDE. All you need is a pip install deephaven-server from your Python environment. (We recommend installing in a virtual environment.)
Running Deephaven then simply requires:
from deephaven_server import Server
server = Server()
server.start()


from deephaven import time_table
table_t = time_table('00:00:02').update(formulas = ["Row = 1", "Squared = Row^2"])
Once you run this in your Python environment, output like the GIF below can be found on your http://localhost:8080/ide/.
Using subtables in clients
In v0.13.0 we released a method called partition_by that enables you to easily split a table into subtables based on keys. This takes advantage of a powerful server-side PartitionedTable construct.
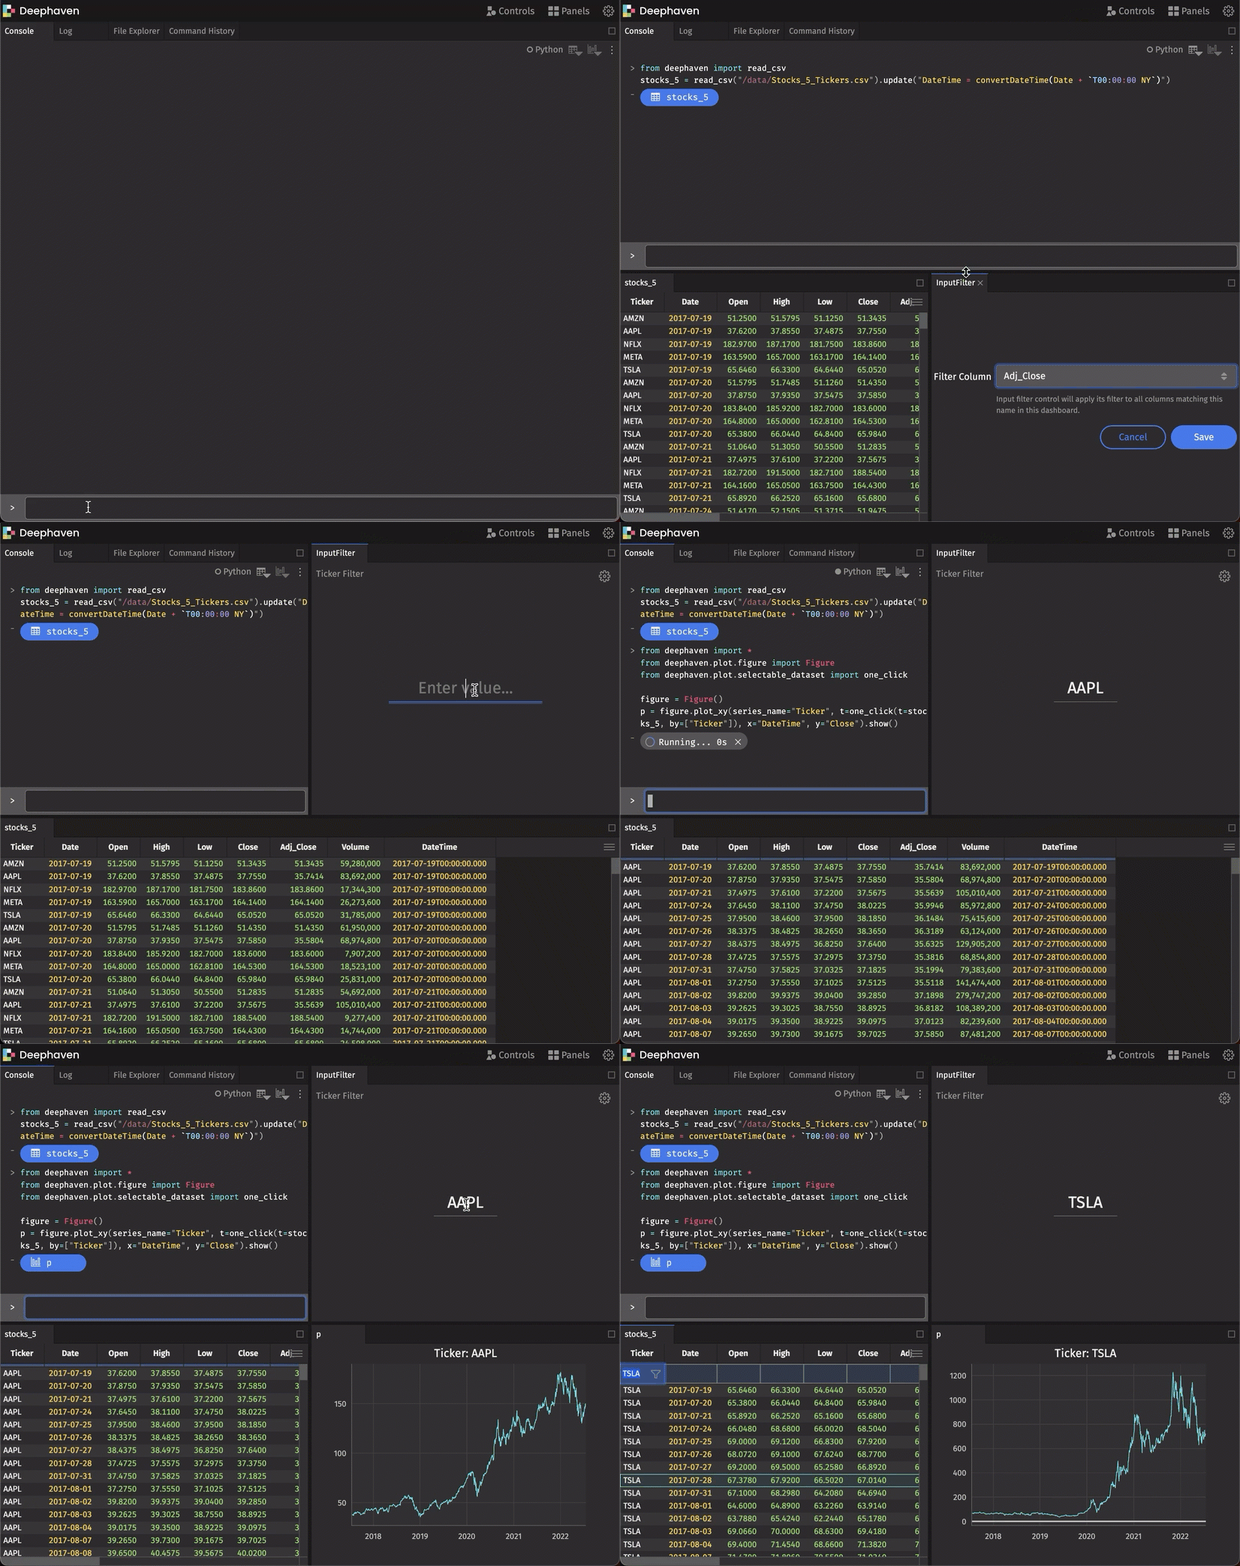
This release extends this construct to Deephaven API clients, enabling clients to receive updates (or snapshots) of just one subtable. (You could pull several subtables.)
Accordingly, using the JavaScript client, you can easily create (what we call) “one-click” experiences in the UI. A query can be written to establish and maintain subtables server-side, with dashboard and widget users able to bring a subtable’s data to the UI by typing in (or otherwise identifying) the key. This provides a quick (and slick) UI-filtering experience.
Plot grouped data with a simple “by” extension
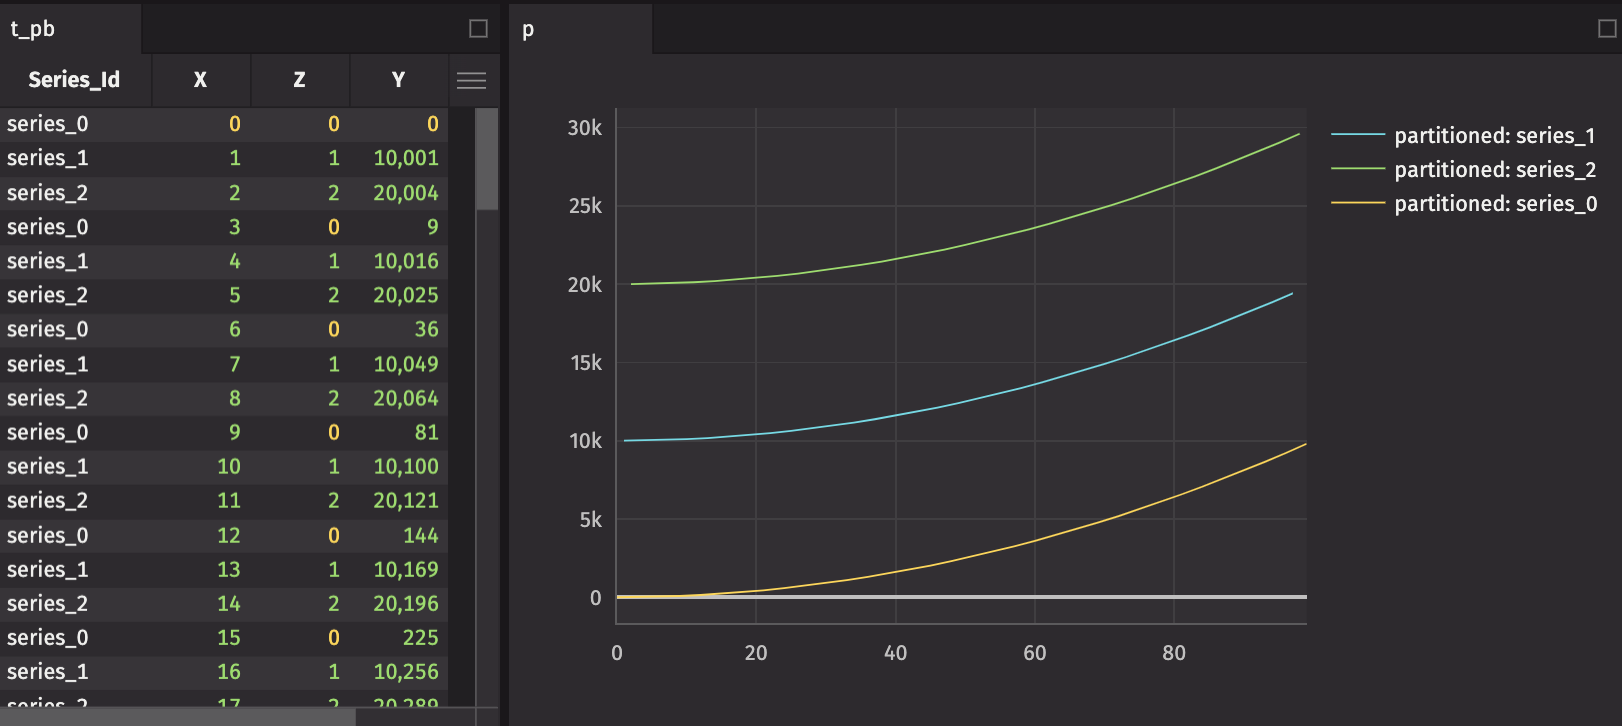
As a follow-on feature of partitionedTables, you can split data on the server and create a plot that presents the respective subtables as independent series. The following script demonstrates the by extension of the plotting API:
from deephaven import *
from deephaven.plot.figure import Figure


t_pb = empty_table(100).update_view(formulas = ["X=i", "Z=i%3", "Y=X*X + Z * 10000", "Series_Id = `series_` + Z"]).move_columns(idx=0, cols=["Series_Id"])


figure = Figure()
p = figure.plot_xy(series_name="partitioned", t=t_pb, by=["Series_Id"], x="X", y="Y").show()
Projecting columns based on grouped data
We have introduced a new table operation, updateBy . This allows columns to be derived from aggregations over a range of rows within a group, producing an output table with the same structure and rows as the input table, but for added columns (as in update). Currently supported aggregations include exponential moving averages (EMAs), cumulative sums, cumulative products, cumulative minimums, and cumulative maximums. In general, updateBy allows for rows to be decorated with results derived from multiple input rows, qualified by the by key.
In the next release, updateBy will be wrapped for Python. Below is a simple Java Groovy example:
cumulative_sum=emptyTable(10).update("RowNum=ii").updateBy(CumSum("RowNumSum=RowNum"))

cumulative_sum_grouped=emptyTable(10).update("RowNum=ii", "Group=RowNum%3").updateBy(CumSum("RowNumSum=RowNum"), "Group")

cumulative_multi_grouped=emptyTable(10).update("RowNum=ii", "Group=RowNum%3").updateBy([CumSum("RowNumSum=RowNum"),CumMin("RowNumMin=RowNum")], "Group")
- cumulative_sum
- cumulative_sum_grouped
A better EMA method for Python users
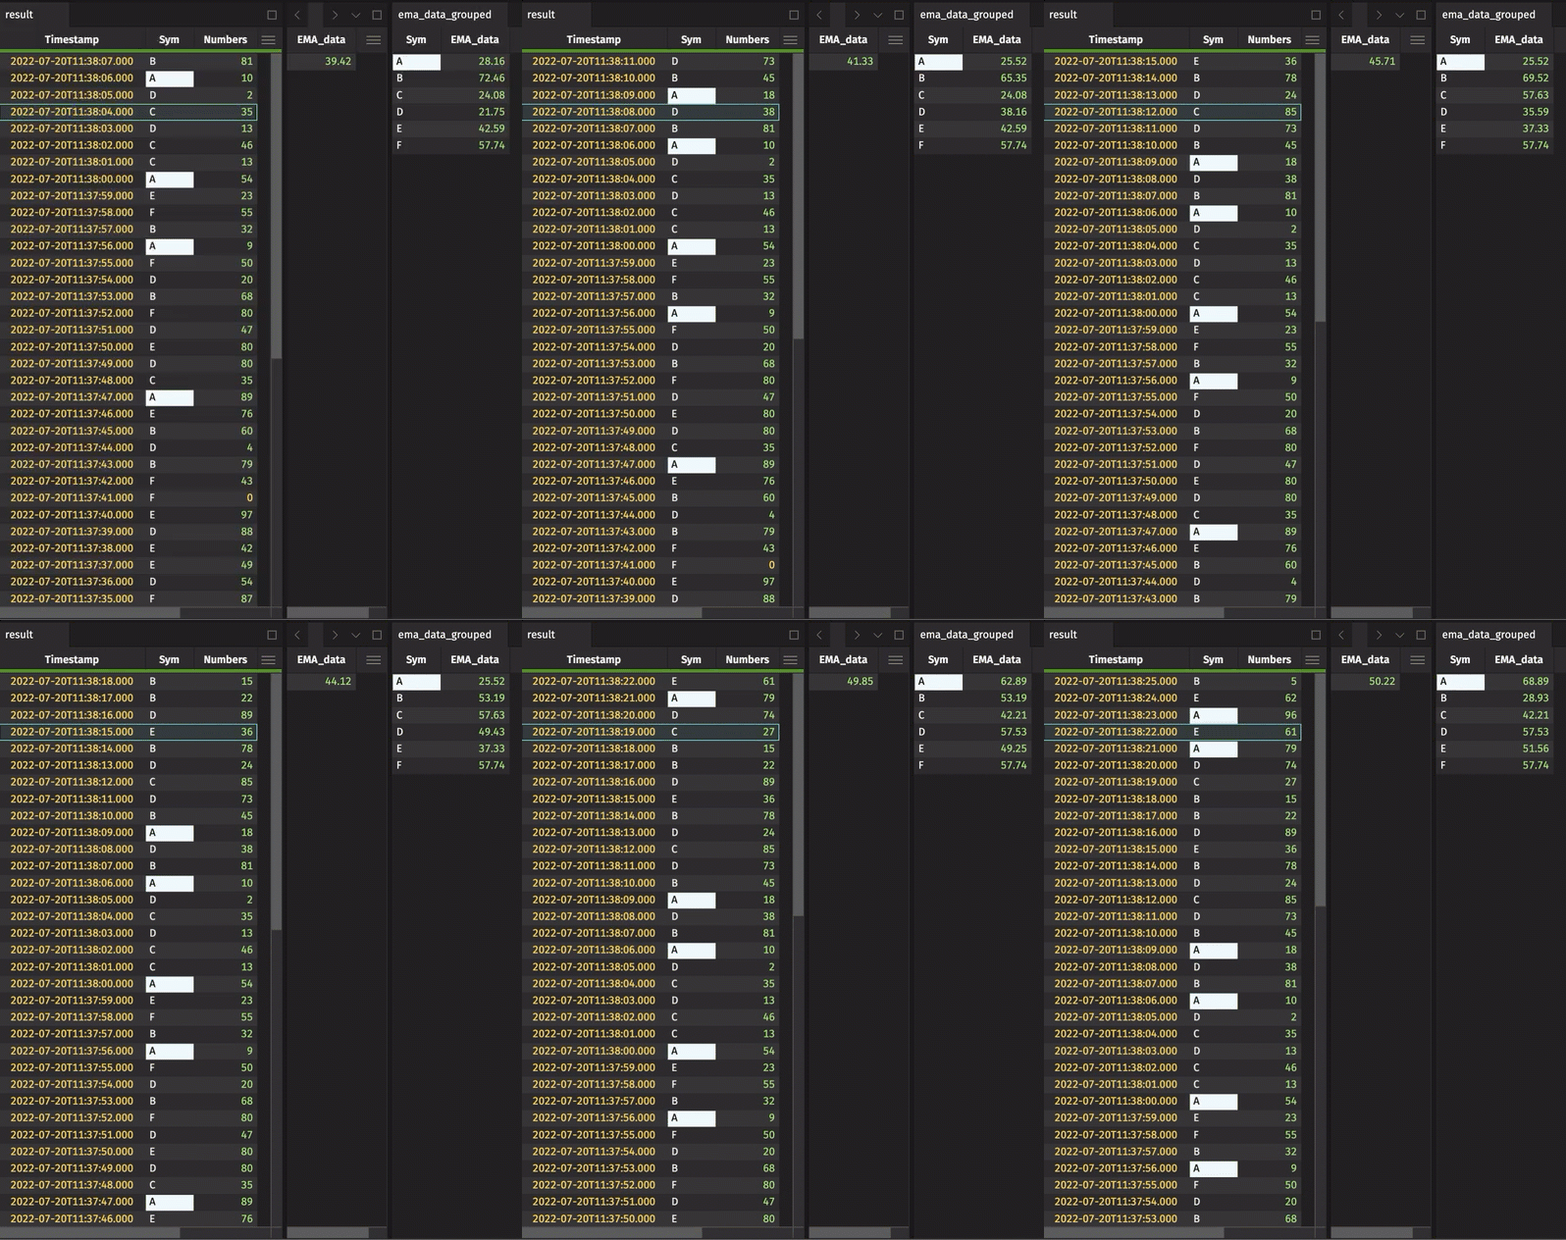
EMAs and other moving averages will inherit more improvements in the next release as the result of incorporating theupdateBy into the Python table API. However, as a step in that direction, the syntax around EMAs is simpler:
from deephaven.experimental.ema import ByEmaSimple
from deephaven import time_table
import random


def random_char():
    return random.choice(['A', 'B', 'C', 'D', 'E', 'F'])
result = time_table('00:00:01').update(formulas=["Sym = (String)random_char()", "Numbers = (int)random.randint(0, 100)"])


ema1sec = ByEmaSimple('BD_SKIP','BD_SKIP','TIME',10,'SECONDS', type='LEVEL')


ema_data = result.view(formulas=["EMA_data = ema1sec.update(Timestamp, Numbers)"]).last_by()

ema_data_grouped = result.view(formulas=["Sym", "EMA_data = ema1sec.update(Timestamp, Numbers, Sym)"]).last_by(by=["Sym"]).sort(order_by=["Sym"])
TensorBoard integration is now available
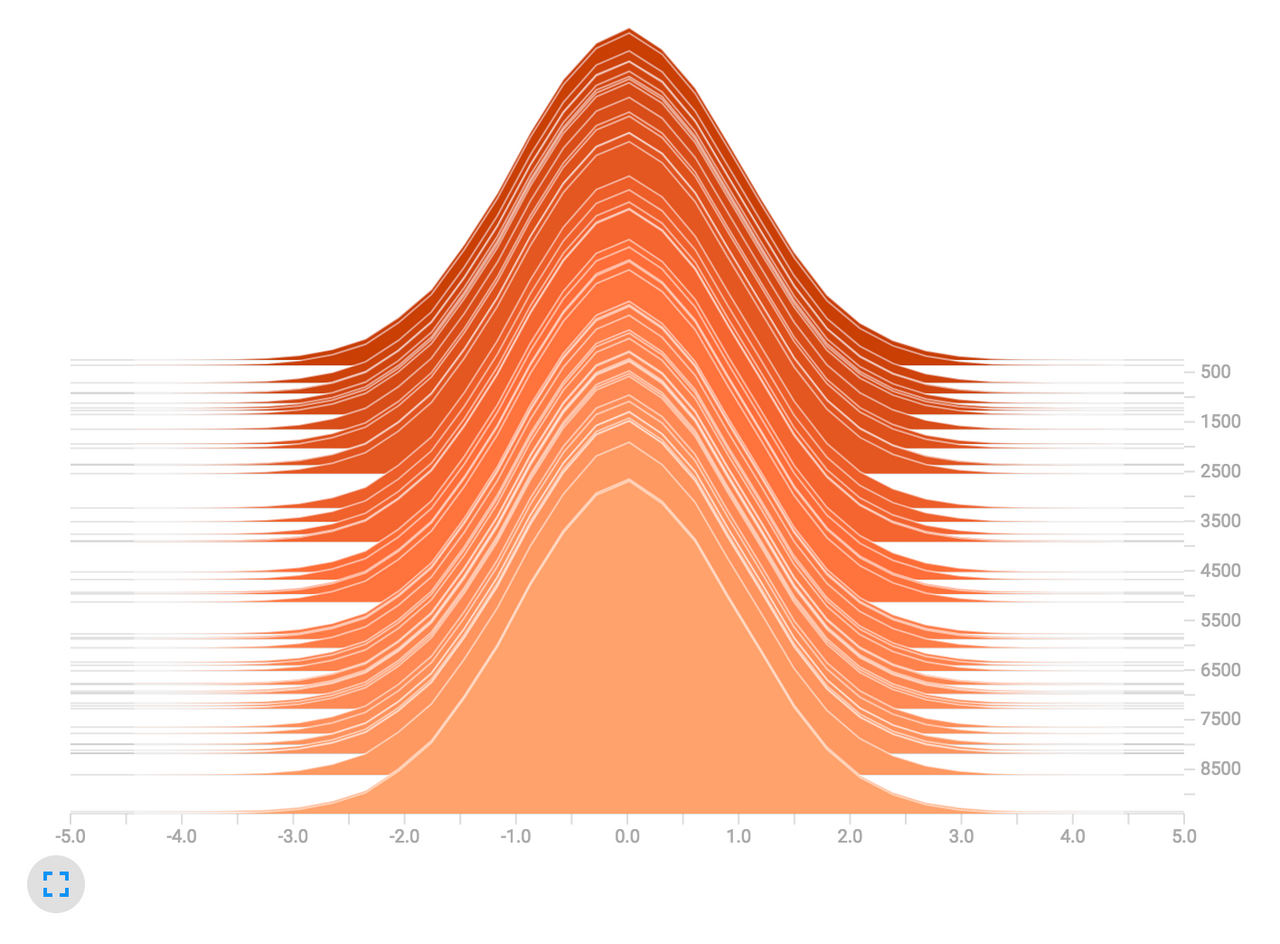
Knowing the popularity of TensorBoard for Python ML and AI users, we have paved the way for its integration with Deephaven. Please reference our how-to’s for using TensorBoard with PyTorch and with TensorFlow, respectively.
SSL
We now support configuring SSL on the Deephaven server for secure environments. You can deploy jetty, netty, or run the server from Python with secure connections from your clients to the server, using certificates you make available.
The development team is prioritizing the following initiatives:
- An integration with Jupyter and Visual Studio Code to support Deephaven’s updating, real-time widgets, such as its interactive, ticking plots and tables.
- A native Go client.
- Dynamic table subscriptions and updates for the C++ client.
- Improved performance of
updateBy(), its wrapping for Python, and its application to other common data manipulation patterns. - Better proxy engineering to minimize browser resource consumption.
- Authentication and authorization hooks and example integrations.
- Research of a direct integration with plotly, removing the need for a Deephaven-specific plotting API.
You can find changes and improvements to the Deephaven user documentation in this blog post.
Please direct feedback, questions, or perspective about product development to Deephaven’s Slack or its GitHub Discussions.
We welcome your direction and look forward to supporting your use cases.
Source link
lol

