Introduction
The Internet of Things (IoT) is generating an unprecedented amount of data. IBM estimates that annual IoT data volume will reach approximately 175 zettabytes by 2025. That’s hundreds of trillions of Gigabytes! According to Cisco, if each Gigabyte in a Zettabyte were a brick, 258 Great Walls of China could be built.
Real time processing of IoT data unlocks its true value by enabling businesses to make timely, data-driven decisions. However, the massive and dynamic nature of IoT data poses significant challenges for many organizations. At Databricks, we recognize these obstacles and provide a comprehensive data intelligence platform to help manufacturing organizations effectively process and analyze IoT data. By leveraging the Databricks Data Intelligence Platform, manufacturing organizations can transform their IoT data into actionable insights to drive efficiency, reduce downtime, and improve overall operational performance, without the overhead of managing a complex analytics system. In this blog, we share examples of how to use Databricks’ IoT analytics capabilities to create efficiencies in your business.
Problem Statement
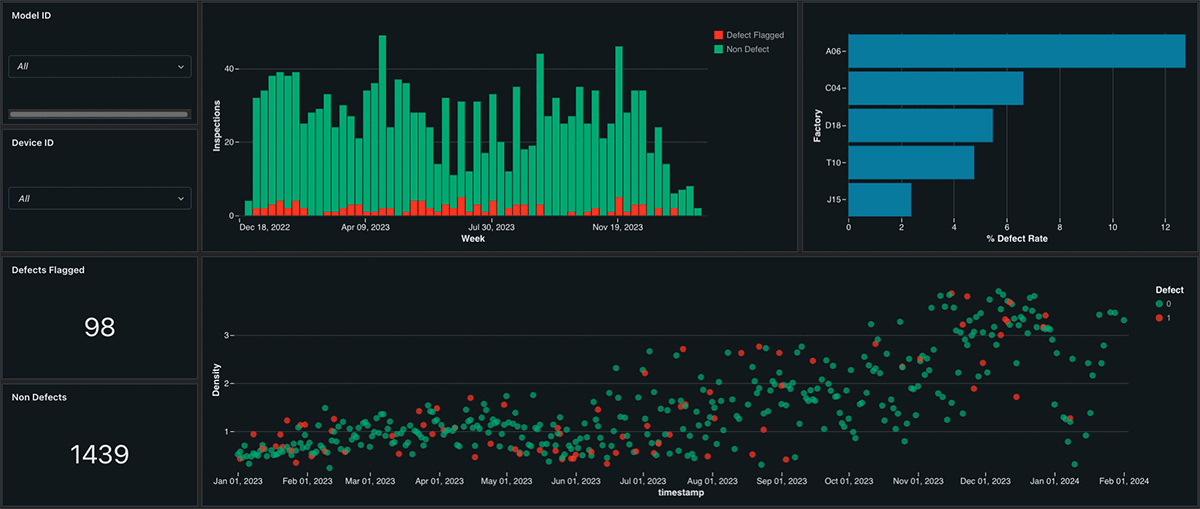
While analyzing time series data at scale and in real-time can be a significant challenge, Databricks’ Delta Live Tables (DLT) provides a fully managed ETL solution, simplifying the operation of time series pipelines and reducing the complexity of managing the underlying software and infrastructure. DLT offers features such as schema inference and data quality enforcement, ensuring that data quality issues are identified without allowing schema changes from data producers to disrupt the pipelines. Databricks provides a simple interface for parallel computation of complex time series operations, including exponential weighted moving averages, interpolation, and resampling, via the open-source Tempo library. Moreover, with Lakeview Dashboards, manufacturing organizations can gain valuable insights into how metrics, such as defect rates by factory, might be impacting their bottom line. Finally, Databricks can notify stakeholders of anomalies in real-time by feeding the results of our streaming pipeline into SQL alerts. Databricks’ innovative solutions help manufacturing organizations overcome their data processing challenges, enabling them to make informed decisions and optimize their operations.
Example 1: Real Time Data Processing
Databricks’ unified analytics platform provides a robust solution for manufacturing organizations to tackle their data ingestion and streaming challenges. In our example, we’ll create streaming tables that ingest newly landed files in real-time from a Unity Catalog Volume, emphasizing several key benefits:
- Real-Time Processing: Manufacturing organizations can process data incrementally by utilizing streaming tables, mitigating the cost of reprocessing previously seen data. This ensures that insights are derived from the most recent data available, enabling quicker decision-making.
- Schema Inference: Databricks’ Autoloader feature runs schema inference, allowing flexibility in handling the changing schemas and data formats from upstream producers which are all too common.
- Autoscaling Compute Resources: Delta Live Tables offers autoscaling compute resources for streaming pipelines, ensuring optimal resource utilization and cost-efficiency. Autoscaling is particularly beneficial for IoT workloads where the volume of data might spike or plummet dramatically based on seasonality and time of day.
- Exactly-Once Processing Guarantees: Streaming on Databricks guarantees that each row is processed exactly once, eliminating the risk of pipelines creating duplicate or missing data.
- Data Quality Checks: DLT also offers data quality checks, useful for validating that values are within realistic ranges or ensuring primary keys exist before running a join. These checks help maintain data quality and allow for triggering warnings or dropping rows where needed.
Manufacturing organizations can unlock valuable insights, improve operational efficiency, and make data-driven decisions with confidence by leveraging Databricks’ real-time data processing capabilities.
@dlt.table(
   name='inspection_bronze',
   comment='Loads raw inspection files into the bronze layer'
) # Drops any rows where timestamp or device_id are null, as those rows wouldn't be usable for our next step
@dlt.expect_all_or_drop({"valid timestamp": "`timestamp` is not null", "valid device id": "device_id is not null"})
def autoload_inspection_data():
   schema_hints = 'defect float, timestamp timestamp, device_id integer'
   return (
       spark.readStream.format('cloudFiles')
       .option('cloudFiles.format', 'csv')
       .option('cloudFiles.schemaHints', schema_hints)
       .option('cloudFiles.schemaLocation', 'checkpoints/inspection')
       .load('inspection_landing')
   )
Example 2: Tempo for Time Series Analysis
Given streams from disparate data sources such as sensors and inspection reports, we might need to calculate useful time series features such as exponential moving average or pull together our times series datasets. This poses a couple of challenges:
- How do we handle null, missing, or irregular data in our time series?
- How do we calculate time series features such as exponential moving average in parallel on a massive dataset without exponentially increasing cost?
- How do we pull together our datasets when the timestamps don’t line up? In this case, our inspection defect warning might get flagged hours after the sensor data is generated. We need a join that allows “price is right” rules, joining in the most recent sensor data that doesn’t exceed the inspection timestamp. This way we can grab the features leading up to the defect warning, without leaking data that arrived afterwards into our feature set.
Each of these challenges might require a complex, custom library specific to time series data. Luckily, Databricks has done the hard part for you! We’ll use the open source library Tempo from Databricks Labs to make these challenging operations simple. TSDF, Tempo’s time series dataframe interface, allows us to interpolate missing data with the mean from the surrounding points, calculate an exponential moving average for temperature, and do our “price is right” rules join, known as an as-of join. For example, in our DLT Pipeline:
@dlt.table(
   name='inspection_silver',
   comment='Joins bronze sensor data with inspection reports'
)
def create_timeseries_features():
   inspections = dlt.read('inspection_bronze').drop('_rescued_data')
   inspections_tsdf = TSDF(inspections, ts_col='timestamp', partition_cols=['device_id']) # Create our inspections TSDF
   raw_sensors = (
       dlt.read('sensor_bronze')
       .drop('_rescued_data') # Flip the sign when negative otherwise keep it the same
       .withColumn('air_pressure', when(col('air_pressure') < 0, -col('air_pressure'))
                                   .otherwise(col('air_pressure')))
   )
   sensors_tsdf = (
           TSDF(raw_sensors, ts_col='timestamp', partition_cols=['device_id', 'trip_id', 'factory_id', 'model_id'])
           .EMA('rotation_speed', window=5) # Exponential moving average over five rows
           .resample(freq='1 hour', func='mean') # Resample into 1 hour intervals
   )
   return (
       inspections_tsdf # Price is right (as-of) join!
       .asofJoin(sensors_tsdf, right_prefix='sensor')
       .df # Return the vanilla Spark Dataframe
       .withColumnRenamed('sensor_trip_id', 'trip_id') # Rename some columns to match our schema
       .withColumnRenamed('sensor_model_id', 'model_id')
       .withColumnRenamed('sensor_factory_id', 'factory_id')
   )
Example 3: Native Dashboarding and Alerting
Once we’ve defined our DLT Pipeline we need to take action on the provided insights. Databricks offers SQL Alerts, which can be configured to send email, Slack, Teams, or generic webhook messages when certain conditions in Streaming Tables are met. This allows manufacturing organizations to quickly respond to issues or opportunities as they arise. Furthermore, Databricks’ Lakeview Dashboards provide a user-friendly interface for aggregating and reporting on data, without the need for additional licensing costs. These dashboards are directly integrated into the Data Intelligence Platform, making it easy for teams to access and analyze data in real time. Materialized Views and Lakehouse Dashboards are a winning combination, pairing beautiful visuals with instant performance:

Conclusion
Overall, Databricks’ DLT Pipelines, Tempo, SQL Alerts, and Lakeview Dashboards provide a powerful, unified feature set for manufacturing organizations looking to gain real-time insights from their data and improve their operational efficiency. By simplifying the process of managing and analyzing data, Databricks helps manufacturing organizations focus on what they do best: creating, moving, and powering the world. With the challenging volume, velocity, and variety requirements posed by IoT data, you need a unified data intelligence platform that democratizes data insights. Get started today with our solution accelerator for IoT Time Series Analysis!
Here is the link to this solution accelerator.
Source link
lol

