Framing and Context
Deephaven recently published a GitHub repository
showing an implementation of Materialize’s e-commerce functional demo using Deephaven as the query engine. Today we want
to explore the difference in performance between our respective solutions and the factors that drive those differences.
Before we start, caveat emptor: Materialize and Deephaven engines come from different corners of the data processing
world; from their genealogy, you would expect them to have distinct proficiencies matching the use cases they grew up to
serve. As we discuss elsewhere, we believe you wouldn’t be wrong in that expectation.
Likely there will be particular use cases for which one of them is a better fit.
However, many use cases live at the intersection of the two engines’ capabilities, so you could rightfully consider
either. We believe this particular e-commerce analysis is such an example: a use case that is fair game for both.
At a high level, we want to investigate the relative performance of our respective engines. To that effect, our specific
goals are:
- Test both Deephaven and Materialize under high message rate load.
- Find the limits for the basic (default) setup for each: specifically, the highest sustainable message rate.
- Explore configuration changes to support higher message rates on each of Materialize and Deephaven.
- Accumulate experience towards establishing a model for performance testing of streaming platforms generally.
As detailed in the Performance Comparison
section below, the differences in design philosophy and targets lead to stark differences in throughput and resource
consumption.
For workloads of all sizes, Deeephaven uses a fraction of the CPU required by Materialize. While Deephaven has a small
amount of memory overhead for small workloads (a touch over a gigabyte), its memory consumption scales very gently in
comparison with Materialize. At higher data rates, around 100k pageviews/second, Materialize uses drastically more CPU
and memory than Deephaven while falling behind on the data. The extreme scalability of Deephaven is a product of its
pedigree in big-data capital markets applications.
| pageviews/second | Materialize CPU | Deephaven CPU | Materialize Mem | Deephaven Mem |
|---|---|---|---|---|
| 50 | 30.6% | 8.3% | 0.16 GiB | 1.30 GiB |
| 5,000 | 179.6% | 33.1% | 0.57 GiB | 1.70 GiB |
| 35,000 | (1) 848.5% | 82.2% | 2.80 GiB | 2.60 GiB |
| 100,000 | (2) 848.4% | 96.2% | 7.00 GiB | 4.60 GiB |
| 145,000 | 149.5% | 5.20 GiB | ||
| 160,000 | 174.6% | 5.90 GiB | ||
| 200,000 | (3) 240.0% | 6.70 GiB |
Next, let’s dig into the construction of the benchmark that produced these results.
We closely
follow the Materialize demo available on GitHub
. We did our best to capture the semantics of the original SQL queries, while converting the code to Deephaven table
operations for execution inside our Python web UI. While we provide a Python script with the full resulting code, we
encourage you to cut & paste Python expressions one at a time in the interactive console and incrementally “build” the
solution while exploring the table results — just as you would if you were working on creating a data model. (
Alternatively, you could paste the entire script in
a Deephaven notebook and step through it
incrementally).
The e-commerce demo has two sources of streaming events:
- Customer purchases, reflected as database transactions in MySQL, which are converted to Kafka Avro-encoded events via
Debezium using its MySQL CDC connector. - Customer pageviews, reflected as Kafka JSON-encoded events.
Multiple derived “streaming tables” (in Deephaven’s terms) or “materialized views” (in Materialize’s terms) are created
from those events, including joins and grouping involving both the purchase and pageview streams.
Our test strategy kept purchases constant and steady, while we increased pageview rates until performance-related delays
were detected. We expected this point would indicate an engine no longer capable of “keeping up”, which would be
confirmed by seeing further increases in refresh delays as customer pageview rates increased. We selected pageviews for
this rate increase instead of purchases for two reasons:
- We believe it more realistic. It’s plausible that pageview spikes would exist on top of a horizontally scaled web
frontend. That is less true for an OLTP oriented database engine like MySQL intermediating CDC events to Kafka (which
works as a “smoothing” function), for the purchases case. - Simulated using only Kafka publishers, pageviews prevent us from worrying about MySQL or Debezium and their
configurations. We wanted to ensure bottlenecks showed in Materialize or Deephaven, not earlier points in the
pipeline.
Tracking Update Delays
We defined one additional streaming table in both Deephaven and Materialize to help detect update delays.
Every pageview event includes a received_at field that is timestamped at the time the pageview simulated action is
created, right before publication. This is not the Kafka Timestamp field on every message, but a specific data field in
the JSON encoded pageview.
Tracking Delays in Deephaven
For Deephaven, we define:
pageviews_summary = pageviews_stg
    .aggBy(
        as_list([
            agg.AggCount('total'),
            agg.AggMax('max_received_at = received_at')]))
    .update('dt_ms = (DateTime.now() - max_received_at)/1_000_000.0')
We ran into two pitfalls trying different ways to define this table:
-
We initially used
update_viewinstead ofupdateto create thedt_mscolumn. In Deephaven,update_viewcreates
columns that are computed when data is pulled (read) from the result table, as opposed to computed and a result stored
in memory on every update cycle. Said differently,update_viewcalculates results on demand. For some use cases,
this is far more efficient in CPU and memory resources. However, for the case at hand, it meant that the timestamping
in the call toDateTime.now()was triggered when the Deephaven web UI refreshed the rendered result, as opposed to
when the Update Graph Processor actually processed new events. Usingupdateensures thatdt_msis calculated
during the Update Graph Processor’s cycle, after computing thetotalandmax_received_atstatistics. -
This is rather technical, but we include it here for transparency:
Separating the new timestamp to its own column in the
updateexpression is tempting, as a way to make the resulting
table more explicit. Like so:.update('now = DateTime.now()',
'dt_ms = (now - max_received_at)/1_000_000.0')However, since the
nowcolumn in this definition does not have any inputs depending on ticking data, Deephaven would
compute it just once, during the initial refresh associated with table creation; as an optimization, subsequent update
cycles would not rerunDateTime.now()to recompute the value. This would causedt_msto use the initialization
time for ‘now’, rather than the current time during the Update Graph Processor cycle. It is possible to override this
optimization and define the column such that it refreshes on every change to the table, but for our purposes it is not
necessary to add that complexity to the script.
Tracking Delays in Materialize
For Materialize, we poll the results for this query:
SELECT total,
       to_timestamp(max_received_at) max_received_ts,
       mz_logical_timestamp() - 1000*max_received_at AS dt_ms
  FROM pageviews_summary;
Originally we tried to define this query as a materialized view. We had to settle for a SELECT statement (that we
execute using psql once per second with the help from the watch shell command, similar to how the original Materialize
demo
README suggests
for another query. The reason is, it
is not possible to
call mz_logical_timestamp in a materialized view definition.
Generating High Pageview Action Rates in Python
The original Materialize demo repository includes the code for a Python script that simulates both purchase actions (via
updating MySQL tables) and pageview actions (via publishing to Kafka-compatible Redpanda). We
started with this code and modified it to support controlling at runtime the rate of both purchases and pageviews. You
can see the resulting script
in the Deephaven repository. The main changes are described below.
- We added a simple command API via socket connection for message rate control.
- Since the Python libraries for MySQL and connection to Kafka both offer a synchronous API, we changed the script to
take advantage of theasyncioPython library to wrap the
synchronous calls: above a certain action rate, the time blocking in a call to generate an action exceeds the implied
period between actions. We started with actions running on top of
aThreadPoolExecutor
, but had to later switch to
aProcessPoolExecutor
due to CPU utilization in a single Python process maxing out (since due to
the GIT a single Python code cannot reach more
than one full CPU utilization). - We wrote
a simple traffic shaping function
that tries to keep a steady rate of actions executed, and is able to adapt the target rate dynamically, by ramping up
or down an estimate of the short term rate. To estimate the short term rate, we wrote
a simple rate estimation algorithm
based on a moving average of rolling fixed-size periods. - Instead of using the default Kafka (Redpanda) topic configuration for pageviews, which in the original demo
auto-creates with a single partition on first message published,
we create the topic via the administrative Kafka API
and configure it for multiple partitions. Using independent Kafka Publisher objects targeting separate partitions per
Python Process Executor enables multiple independent partition streams at both the publisher and broker level.
We configure the Kafka producers
to disable producer acks and for increased batch size. Disabling producer acks is a setting that compromises correctness
for performance, and you should seldom do this in a real production environment. In our context, however, with all
processes running in a single-machine dockerized compose, we do it with the goal of maximizing broker throughput and
minimizing producer blocking call times.
Configuring Docker Compose for High Message Rate
We want to ensure a high message rate reaches the query engines. As much as possible, we want to prevent intermediate
systems from introducing queuing or delays, or any smoothing out effect in front of the engines. We change the
docker compose configuration accordingly:
Test Platform
The following hardware and software setup was used:
- Intel Core i9-10900K (10 cores, 20 threads, 20 MiB cache, 3.7 GHz base / 5.3 GHz max freq)
- 128 GiB RAM
- Ubuntu Linux 20.04.
mbw -t0 8192reports memory bandwidth at an average of
9611.7 MiB/s.
Test Plan
The test plan below repeats in greater detail the instructions summarized in
the README.md file
for the debezium/perf directory.
-
Ensure everything starts afresh and there is no “memory” of previous runs stored in container filesystems or volumes.
On thedebezium/perfdirectory run:docker compose stop
docker compose down -v -
Start
docker composeand save log output to a file. On thedebezium/perfdirectory, run:docker compose up -d
nohup docker compose -f logs >& /tmp/perf.log < /dev/null & -
Wait until Debezium has finished initialization (log line stating “Keepalive thread is running” shown) and loadgen
has initialized the database (log line stating “Initializing shop database DONE”).
-
Open a web browser tab and connect to the Deephaven web console at:
In the console, run
the Deephaven Python script
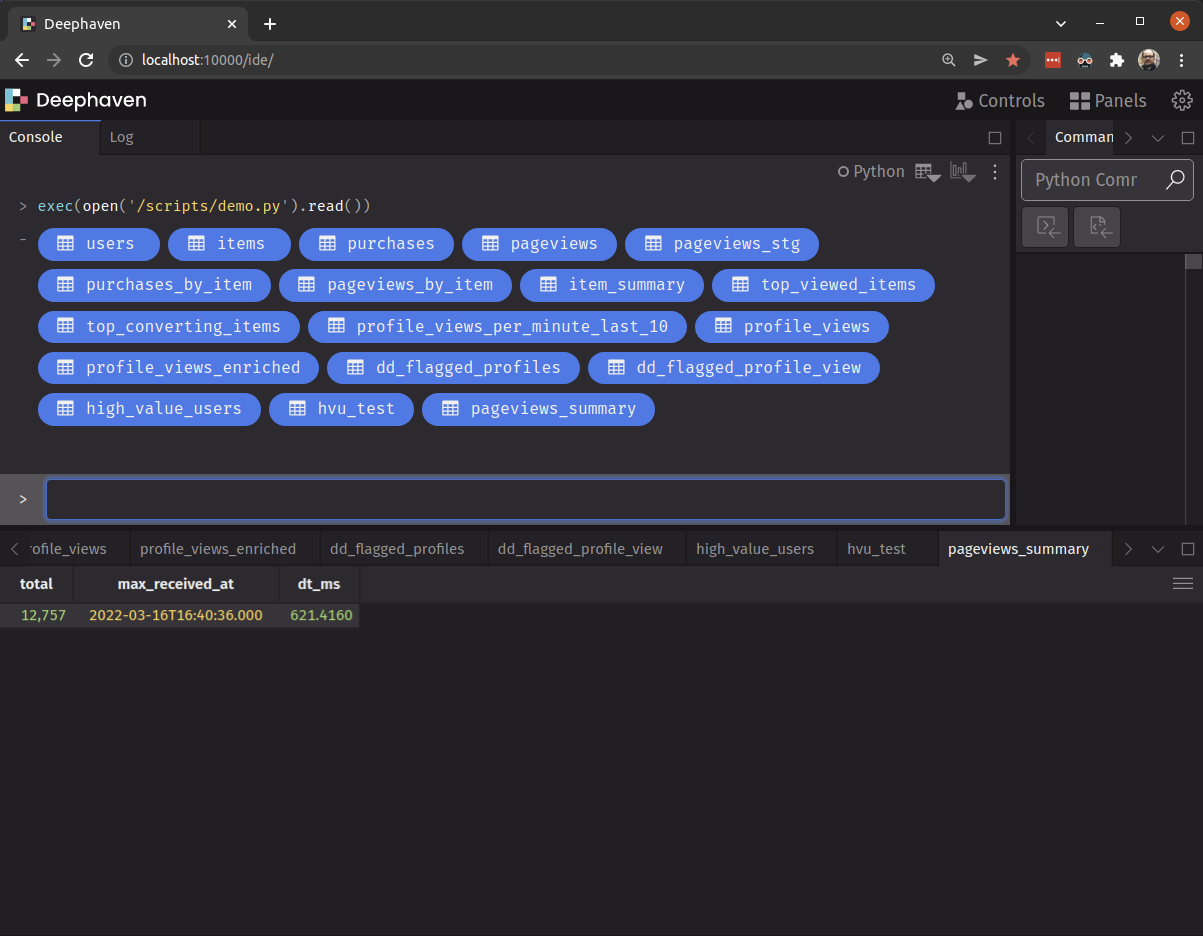
that creates the demo tables via:exec(open('/scripts/demo.py').read())This will create several Python top level variables, one for each table.
Each table becomes a tab in the UI showing the current table data. Right after the statement that created them, you
should see one icon (displayed prominently in blue) for each variable. Clicking an icon jumps you to the respective
table display. -
Switch to the tab for the
pageviews_summarytable to display it. You should see a single row with columnstotal(
accumulated number of pageview events processed),max_received_at(most recent timestamp across all pageview
events), anddt_ms(the difference in milliseconds between max_received_at and the current time). As the default
Deephaven configuration updates tables once per second, an OK value of dt_ms can be anything between zero and 1,000
milliseconds. This configuration is often meaningfully lowered for other use cases, but we are sticking with defaults
here.
-
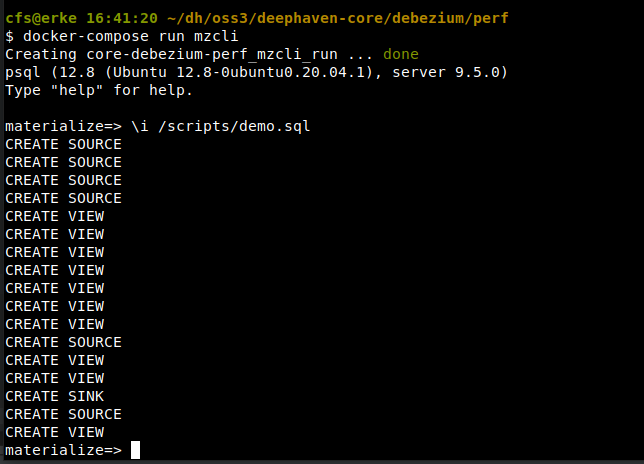
Start Materialize’s command line interface. On the
debezium/perfdirectory, run:Inside the CLI, load the SQL code for the Materialize demo:
You should see several lines of output stating
CREATE SOURCEand thenCREATE VIEW.
Exit the CLI with
Ctrl-Dand run the followingwatchcommand in the shell:watch -n1 "psql -c '
SELECT
total,
to_timestamp(max_received_at) max_received_ts,
mz_logical_timestamp() - 1000 * max_received_at AS dt_ms
FROM pageviews_summary;' -U materialize -h localhost -p 6875"
You should see the results of the
SELECTquery above executed once per second. Note this requires the host to have
thepsqlcommand installed, which is part of the PostgreSQL client tools package in most linux distributions (e.g.
in Ubuntu 20.04 the package ispostgresql-client-12)
-
To allow us to track CPU and RAM utilization, on a separate shell (or terminal window) run the
topcommand.You should see near the top of the processes by CPU utilization
redpanda,materialize,java(this is the Deephaven
engine), andpypy. Note%CPUandRES(RAM resident size, in KiB if no unit indicated) for each as we start. The
start rates are 3 purchases per second and 50 pageviews per second, which should create some noticeable, albeit low,
CPU load, enough for our process of interest to already be showing up in top’s list.
-
Connect to the socket command line client for the generate load script:
We used netcat above, part of the
netcat-bsdUbuntu package, but you can use other tools like telnet if you prefer.
Set the desired rate of pageviews while you watch top and the table fordt_msin both Materialize and Deephaven (
10,000 is an example below, modify as required):set pageviews_per_second 10000
The docker compose log should show loadgen output acknowledging the change, with a message reading “Changing pageview
rate from 50 to 10000 per second”.
After a few seconds (it is logged every 10), the docker compose log should show
loadgengenerating an effective
rate close to the one requested, with a message reading similar to “Simulated 99007 pageview actions in the last 10.0
seconds, effective rate 9896.08/s”. Note it may take two cycles of 10 second rate logging to show the new rate as
steady, since the change likely happens in the middle of a particular cycle and affects its count of messages only
from that point forward.
-
Wait a few seconds for the new rate to settle and use
topto sample CPU (%CPUcolumn) and Memory (REScolumn)
utilization.
Test automation
Manually executing the test plan is prone to several sources of variation.
- In the default period of one sample per second, top samples vary considerably from one to the next: instantaneous CPU
utilization is not a good approximation for CPU utilization over a period of time. Thus ideally one would like to take
several instantaneous samples over a period and use them to approximate a value for the period. - As time passes, the engines require more memory to store derived data for growing tables: to make an experiment run
repeatable, ideally samples should be taken a given constant time after a new rate is set, which in turn should happen
quickly after compose startup.
To avoid these pitfalls for manual execution, we created an automated experiment that runs with a script.
The run_experiment.sh script in the debezium/perf directory automates:
- startup of the containers required for a particular run (and only those)
- saving container logs
- loading the demo code in the respective engine and sampling of engine delays to a log file
- setup of a new given pageviews per second rate, and a fixed wait time thereafter for processing to settle
- sampling of CPU and memory utilization via top to a log file
- stop and reset of the containers
Example
cd debezium/perf
./run_experiment.sh dh 5000 20 10 1.0
This will run an experiment for Deephaven (tag dh; use tag mz for Materialize) with a target rate of 5,000 pageviews
per second. It will wait 20 seconds after setting the target rate to begin sampling CPU and memory utilization
using top in batch mode. 10 samples will be obtained, with a delay of 1.0 seconds between samples .
Summary of automated results
The table below shows the mean CPU utilization and the max memory utilization for a period of 10 seconds, starting after
20 seconds a new pageviews per second rate was set. Every run is started afresh, and only one of the two engines is
running.
| pageviews/second | Materialize CPU | Deephaven CPU | Materialize Mem | Deephaven Mem |
|---|---|---|---|---|
| 50 | 30.6% | 8.3% | 0.16 GiB | 1.30 GiB |
| 5,000 | 179.6% | 33.1% | 0.57 GiB | 1.70 GiB |
| 35,000 | (1) 848.5% | 82.2% | 2.80 GiB | 2.60 GiB |
| 100,000 | (2) 848.4% | 96.2% | 7.00 GiB | 4.60 GiB |
| 145,000 | 149.5% | 5.20 GiB | ||
| 160,000 | 174.6% | 5.90 GiB | ||
| 200,000 | (3) 240.0% | 6.70 GiB |
- We reconfigured Materialize to run with 8 workers.
- Materialize is falling behind at this point, as evidenced
bylogs/2022.03.22.05.04.28_UTC_mz_100000/mz_sample_dt.log. - The Deephaven update cycle is taking longer than 1 second, as logged
inlogs/2022.03.22.05.09.52_UTC_dh_200000/docker-compose.log.
You can download the logs produced for these runs here.
Details for some manual runs
Note the results below were obtained manually, which is prone to issues mentioned in the previous section. Still, we
believe it is useful to display some top screen captures and videos recorded for a couple of cases.
-
On startup with the initial 3 purchases per second and 50 pageviews per second:
- Materialize consumes 229 MiB RAM and 46% CPU.
- Deephaven consumes 1.8 GiB RAM and 3% CPU.

-
Increasing pageviews per second to 5,000:
- Materialize consumes 899 MiB RAM and 168% CPU.
- Deephaven consumes 2.6 GiB RAM and 47% CPU.

The output from top oscillates quite a bit at this point. A later reading a minute later is a bit more stable (but
there are still oscillations):- Materialize consumes 1.2 GiB RAM and 157% CPU.
- Deephaven consumes 3.0 GiB RAM and 18% CPU.
 Note as time passes, both engines need to increase their memory consumption given the accumulation of data on
tables that grow as new events arrive.
-
Increasing pageviews per second to 35,000:
- Materialized consumes 4.8 GiB RAM and 244% of CPU.
- Deephaven consumes 5.1 GiB RAM and 92% CPU.

We note the watch command for the
psql SELECTquery withdt_msfor Materialize is refreshing in jumps of several
seconds. We suspect Materialize is running short of CPU given the default configuration of -w2 with 2 workers.Deephaven meanwhile is still refreshing consistently every second.
You can get more details about the Deephaven Update Graph Processor refresh cycle in the docker-compose log for
Deephaven server, in log lines readingUpdate Graph Processor cycleTime=....
At this point, we stop the test and reconfigure Materialize with 8 workers, by modifying the
.envfile in
thedebezium/perfdirectory and settingMATERIALIZE_WORKERS=8, restart from the beginning of the test plan, and
set pageviews per second to 35,000. With 35,000 pageviews per second and 8 workers, we see Materialize consumes 4.1
GiB RAM and 829% CPU.
Updates to the watch psql command are refreshed once per second, so with 8 workers Materialize is keeping up.
-
Restarting with 100,000 pageviews per second:
- Materialize consumes 9.9 GiB RAM and 801% CPU.
- Deephaven consumes 5.8 GiB RAM and 200% CPU.

We are still running Materialize with 8 workers here, which probably explains why CPU utilization stays around 800%.
We encourage you to explore our GitHub code and
to draw your own conclusions. We look forward to feedback, insight, and curiosity from the community.
-
With respect to memory utilization, at high message rates (say, 200k msg/sec), it does not take more than a few
minutes under the default Deephaven configuration for the Deephaven engine to run out of memory. As our engine is
Java based, we need to define a maximum heap size on startup, and our defaults set that to 4 GiB in our core repo,
and 12 GiB in this demo. To facilitate longer testing this is easily modified: in the.envfile on
thedebezium/perfdirectory, setDEEPHAVEN_HEAPto the desired value; this translates to the value used for
thejavacommand-Xmxoption. This does not impact initial memory allocation, but provides a hard limit on total
memory allocation. Although a limitation here for our current purposes, in production deployments with shares
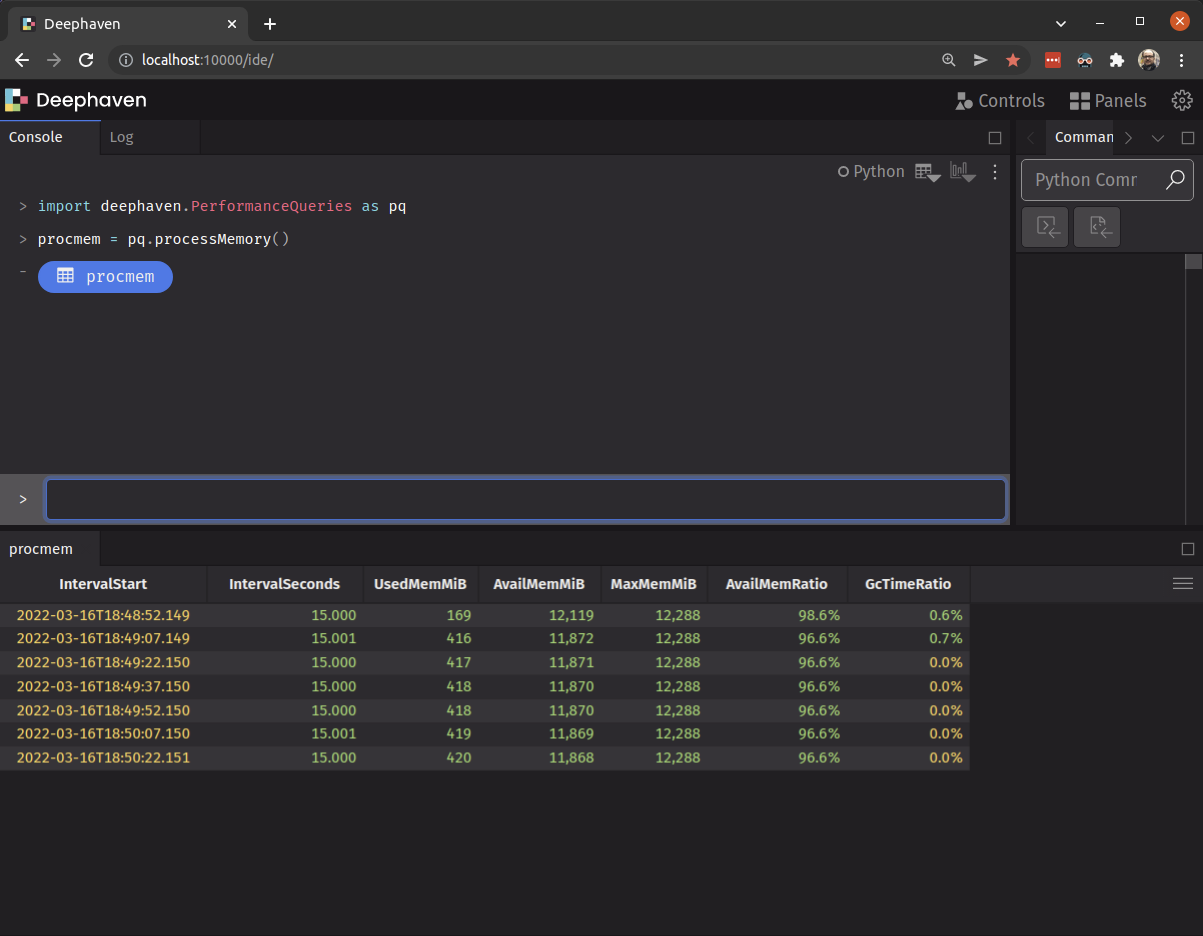
resources this is helpful. You can monitor actual memory utilization throughtopor inside the DH web console using
theprocessMemorytable from thePerformanceQueriespackage, as follows:import deephaven.PerformanceQueries as pq
procmem = pq.processMemory()This will create a table that updates very 15 seconds with memory statistics for the Deephaven engine process,
including percentage of time spent in Garbage Collection.
Source link
lol

