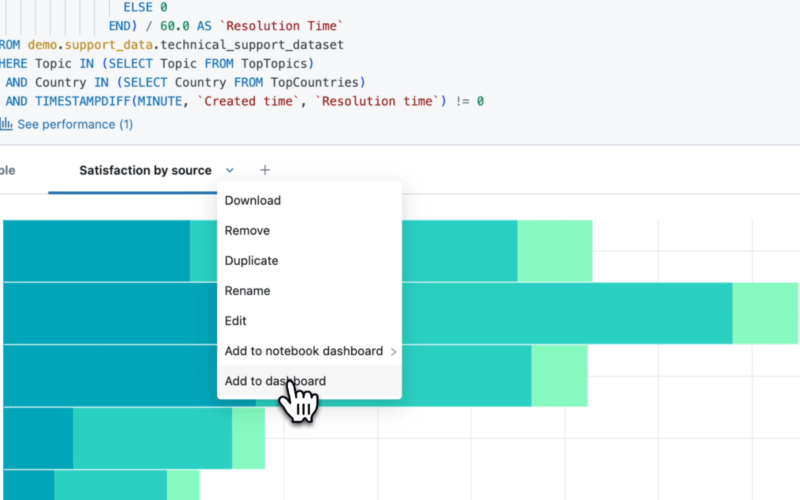
We’re excited to announce a new integration between Databricks Notebooks and AI/BI Dashboards, enabling you to effortlessly transform insights from your notebooks into shareable, polished dashboards. This feature reflects our continuous efforts to integrate beautiful, low-code dashboarding into your work across the Databricks platform. This integration allows you to present your notebook analysis in a professional, interactive dashboard and easily share it with business users and stakeholders, across your entire organization.
How does this integration work?
This new functionality enables you to integrate SQL notebook cells—complete with queries, parameters, and visualizations—into AI/BI Dashboards. It provides practitioners with the best of both worlds: the flexibility to begin their data analysis in notebooks, combined with the ease of presenting and sharing insights through AI/BI Dashboards.
As a data analyst we recognize that you spend a lot of upfront time performing exploratory data analysis (EDA) in your notebook, exploring, profiling, and visualizing your data prior to building out dashboards for your business teams. This new capability allows you to easily transition from EDA into dashboards, avoiding context switching and recreating visual artifacts in multiple places.
Why Transition from Notebook Dashboards to AI/BI Dashboards?
While notebook dashboards have been a useful tool for assembling visualizations directly on top of a notebook, AI/BI Dashboards offer several important advantages that make them the preferred choice for future workflows:
- Rich consumption experience: AI/BI Dashboards come with features like Genie integration, cross-filtering, multi-page support, built-in performance optimizations, and independent user sessions.
- Independent viewing sessions: Unlike notebook dashboards, filter changes in AI/BI dashboards are scoped to an individual users session, allowing multiple users to interact with dashboards concurrently without affecting each other’s experience.
- Flexible sharing and embedding: AI/BI Dashboards simplify sharing by allowing you to embed them as iframes or share directly with view-only business users, making insights accessible to a broader audience.
- AI-augmented builder: AI/BI Dashboards provide a modern point and click editing experienced augmented with a natural language interface.
- Improved scalability and management: AI/BI Dashboards provide a unified content model that allows for cross-workspace import/export and version control, making them easier to maintain and evolve over time.
Getting Started:
- Open a notebook and navigate to any SQL cell
- Either using the kebab menu or the dropdown next to any visualization title, click “Add to Dashboard”
- Create a new dashboard or select an existing dashboard. You’ll be prompted to either create a new dashboard or select an existing one. The dashboard title will auto-fill based on the notebook name, but you can customize it as needed.
- You will be automatically redirected to the dashboard where your content has been copied. If your notebook cell contains visualizations, they will be added to the dashboard canvas. Parameters will also be migrated and set up as single-select filters in the dashboard.
Conclusion
The notebooks to AI/BI Dashboards integration allows you to seamlessly present and share insights generated from notebooks across your organization as polished dashboards. We’re excited to see how you and your teams will leverage this alongside AI/BI’s many other capabilities to transform your business processes. We encourage you to dive in and start creating your own dashboards today. To get started, explore our AI/BI Dashboards documentation and follow our tutorial to build your first dashboard. To see AI/BI Dashboards and Genie in action, check out our demo and take the product tour.
Source link
lol

