Allen AI is doing great applied research in the area of generative AI. With their release of Molmo, a family of multimodal models based on Olmo and Qwen2, they proved that good quality data can often triumph over larger models when it comes to results and human preference. Diving into the models first-hand is the best way to judge how good the models are. This article will cover the Molmo technical report and multimodal inference using the Molmo-1B model.
Primarily, we will cover the following topics while discussing about Molmo
- What was the motivation of the authors for creating Molmo?
- What was the dataset collection strategy and what are the accompanying datasets?
- How were the Molmo models built and what are their architectures based on?
- How do the Molmo models stack up against other open and closed multimodal models?
- What are the Molmo models capable of?
- What are the different ways to use Molmo?
- Official Molmo demo.
- Running models locally.
What is the Motivation Behind Creating Molmo?
The Molmo family of models and PixMo group of datasets are introduced in the technical report named Molmo and PixMo: Open Weights and Open Data for State-of-the-Art Multimodal Models by researchers from Allen Institute of AI and University of Washington.
The primary aim behind creating Molmo is to contribute to completely open research for creating state-of-the-art VLM (Vision Language Model) all the while competing with closed models like GPT4-o and Claude-3.5.
Further, the researchers also wanted to create a dataset from the ground up rather than distilling it from large closed-source models like GPT-o or GPT4-V.
The third reason is to educate the community of researchers and deep learning developers regarding the following:
- What is the process of dataset collection from the ground up for training a VLM?
- How to move away from proprietary data and build with open science in mind?
- How to detail the modeling and training pipeline for others to replicate?
All that said, the magic of Molmo lies in the newly curated dataset.
Let’s get into the technical details now.
What was the Dataset Collection Strategy for Creating Molmo?
Collectively, the family of datasets used to train Molmo is called PixMO (Pixels for Molmo). The PixMo dataset is the secret sauce behind the performance of Molmo models.
Collecting datasets for training VLMs is complex and time consuming. What are the problems associated with curating datasets for VLMs?
- When annotators are given thousands of images to annotate, they often pass them through proprietary VLMs to generate the captions. This destroys the purpose of “not distilling” Molmo from larger models.
- Even when the annotators do not pass them through larger proprietary VLMs, they often type shallow descriptions. This does not provide enough context about the image and often touches upon the most important parts only while missing out on a lot of details.
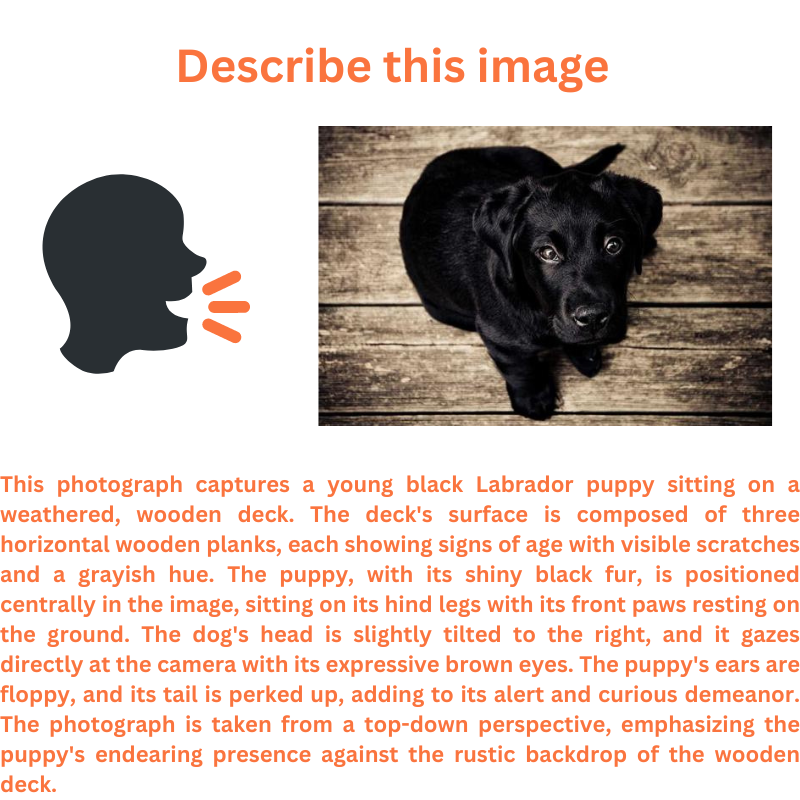
To overcome the above hurdles, instead of typing the image descriptions, the authors asked the annotators to describe the image for 60 to 90 seconds through speech. This simple yet natural process allows the annotators to go into minute details of the images. This results in two major groups of datasets:
- PixMo-Cap: A pretraining multimodal dataset containing dense captions of images. This primarily is used to train the models to generate captions. The dataset includes 70 high level topics.
- PixMo-*: A family of datasets for supervised fine-tuning of the Molmo VLMs. The following sections outline all the datasets in the PixMo-* family.
PixMo-* For Supervised Fine Tuning
Here is a brief about the different dataset variations included:
- PixMo-AskModelAnything: A collection of data containing several questions about images. This enables the models trained on it to answer diverse questions related to the images.
- PixMo-Points: This is a collection of pointing data (in simple words, 2D keypoints). This allows the models to point towards objects when asked and count objects as well.
- PixMo-CapQA: This is a collection of question-answers about the images. An LLM was used to generate captioned QA pairs from the ground truth captions.
- PixMo-Docs: A collection of code generated from documents that are heavy with figures, charts, tables, and images. An LLM was used for this.
- PixMo-Clocks: This is perhaps one of the unique aspects of the dataset. A collection of analog clock faces that teaches the models to tell time.
- Academic datasets: Along with the above, the dataset includes the commonly used academic datasets involving VQAs for several charts, scientific topics, texts, etc.
Section 3 of the report lays out all of the above components in great detail. I highly recommend going through it at least once.
What is the Molmo Model Architecture And What are the Models?
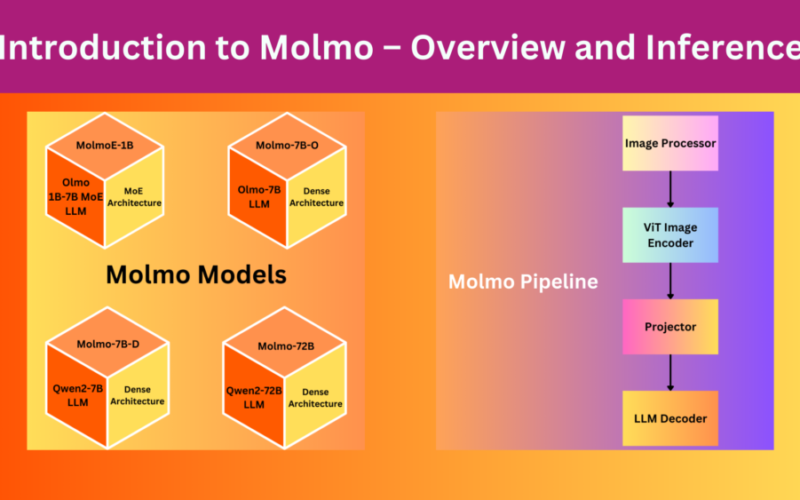
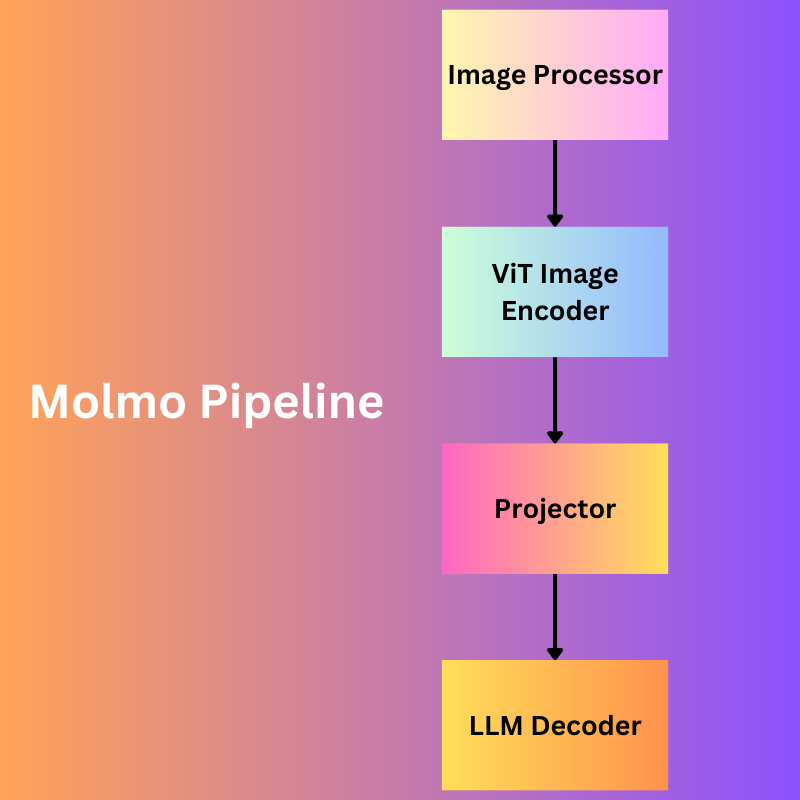
The Molmo models are a combination of four simple steps/models:
- Image preprocessor: This is responsible for converting the images to a set of multiscale, and multi-crop patches. Exploring the configuration files provided along with the Hugging Face checkpoints reveals that all the images are first resized to 336×336 pixels. Note that the image processor is not a deep learning model, but rather a set of image processing steps.
- ViT Image Encoder: The image encoder maps the images to a set of vision tokens. And as is the norm, most probably it does positional encoding of the patches as well. The authors use the OpenAI ViT-L/14 336px CLIP model here.
- Projector: Often the dimensions of the outputs from the vision encoder and input to the LLM do not match. Also, there is a difference between the learned weights from both. So, the projection layer is responsible for projecting the encoder’s outputs to the LLM’s input dimension as a learnable layer and pools the tokens as well.
- LLM Decoder: The final component, of course, is a large language model, based on decoder only Transformer model.
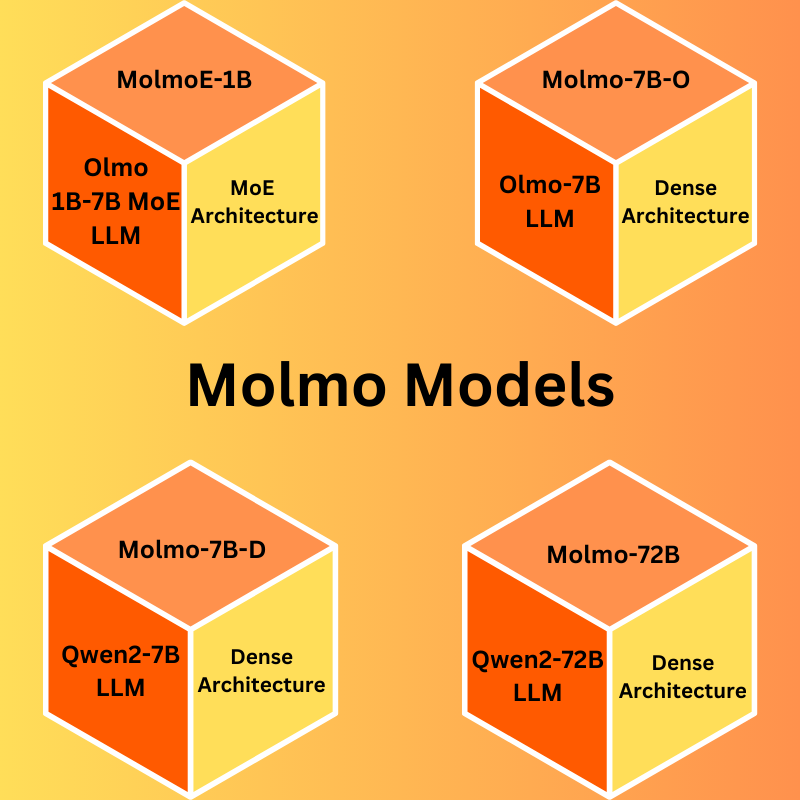
All the Molmo models are based on open-source decoder LLMs. Note that all the decoder LLMs are not released as of writing this. The following are the models:
- MolmoE-1B: This is a completely open model based on a mixture of experts with 7B parameters and 1B active parameters.
- Molmo-7B-O: This is also a completely open model based on the Olmo 7B dense model. The dense model is not released as of writing this.
- Molmo-7B-D: The authors term this as a demo model and it is based on the Qwen2 7B dense LLM.
- Molmo-72B: This is their largest and flagship model based on Qwen2 72B LLM.
How do the Molmo Models Stack Up Against Other VLMs?
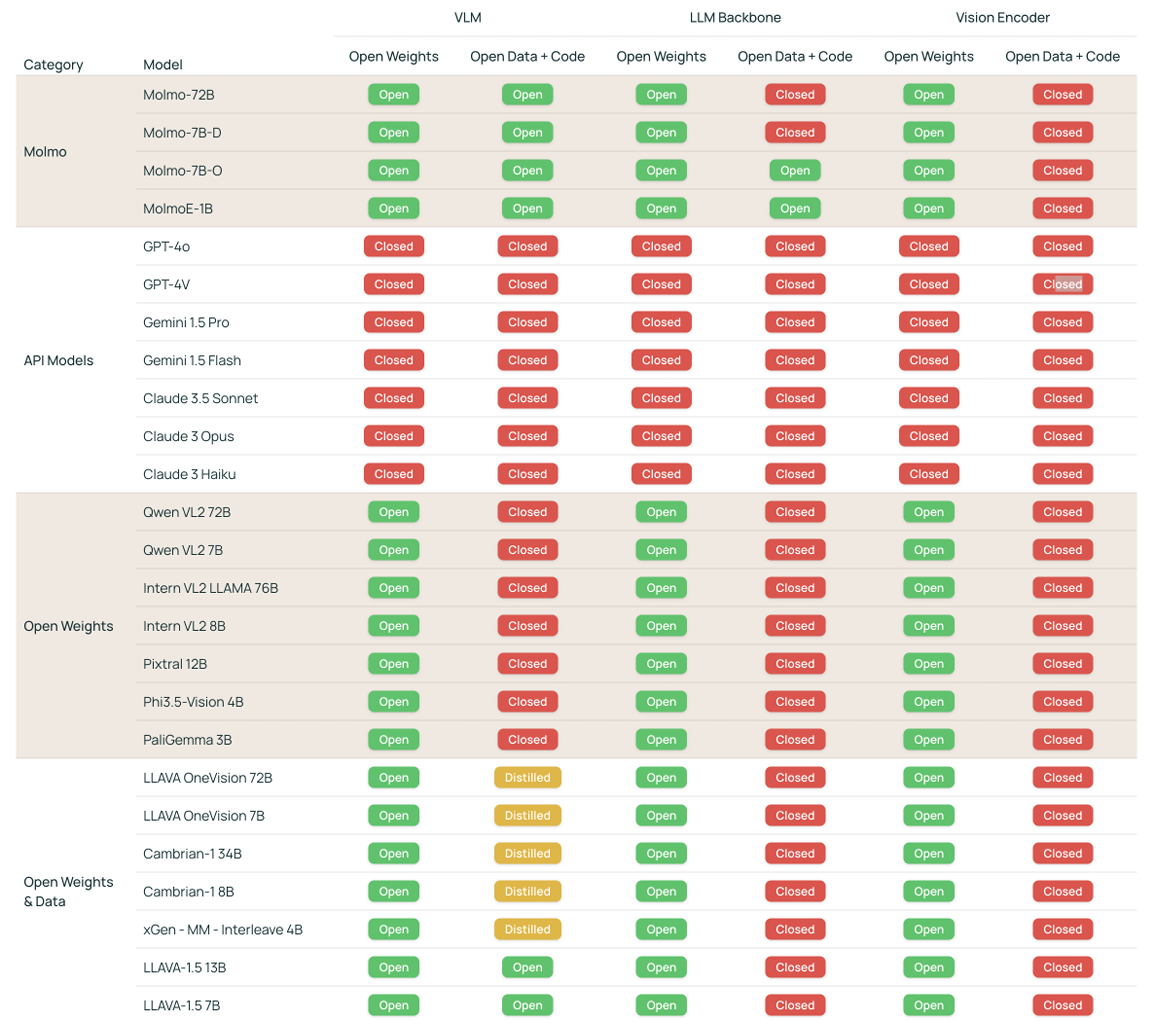
Firstly, the authors provide quite a useful table showing each closed and open VLM’s “openness” which covers the weights, backbone, and vision encoder.
From the above, it is clear that the Molmo family of models is the most open one in terms of code, data, and weights.
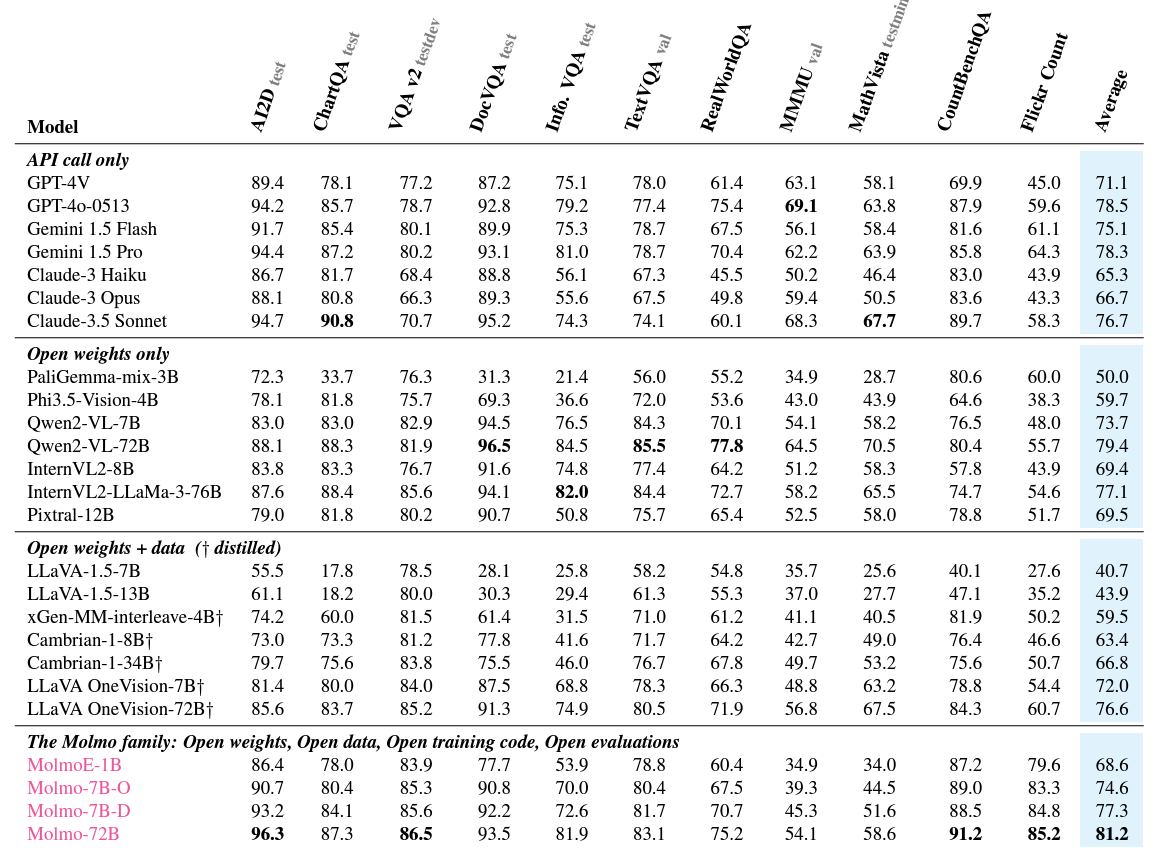
Secondly, the benchmark table.
The above table contains the benchmarks and comparisons against the most common VLMs and ten commonly used benchmarking datasets. However, for the counting benchmark, the authors introduce a new Flickr Count dataset which is more challenging compared to its previous counterparts.
Observing the above table reveals that the Molmo-72B performs the best among all models on average. However, the astonishing fact is that even the 7B models are either neck-to-neck or even beat some of the proprietary closed-source VLMs like Claude-3.5 and GPT-4V. This establishes the fact that curating a strong dataset from the ground up can make a difference.
What are the Different Ways to Use Molmo?
The easiest way to get started with Molmo is to use their official demo page.
You can find different image captioning/description, counting, and pointing demos on the page.
You can also upload your own images and start chatting with them.
The second method is running the models locally using Hugging Face checkpoints which we are going to cover in the next section.
Running Molmo Locally
In this section, we will go through the code using MolmoE-1B-7B model to carry out inference locally.
You can download the code by clicking on the button below.
Download Code
Extracting the zip file will reveal the following directory structure.
├── input
│   ├── image_1.jpg
│   ├── image_2.jpg
│   └── image_3.jpg
├── molmo_1b.ipynb
├── molmo_7bd_non_quant.ipynb
├── molmo_7bo_non_quant.ipynb
├── README.md
└── requirements.txt
We have three notebooks using three different models, however, here we will focus on the molmo_1b.ipynb notebook. The inputs directory contains a few images that we will use for inference.
The base framework is PyTorch which you can install from here. You can use the requirements.txt file to install the rest of the requirements.
pip install -r requirements.txt
Importing The Modules
Let’s start with importing all the necessary modules.
from transformers import (
    AutoModelForCausalLM,
    AutoProcessor,
    GenerationConfig,
    BitsAndBytesConfig
)
from PIL import Image

import requests
import cv2
import matplotlib.pyplot as plt
import re
We will need OpenCV and Matplotlib to visualize the keypoints as we carry out the pointing demos.
Loading the Processor and the Model
Next, we need to define the quantization configuration, the MolmoE processor, and the model.
quant_config = BitsAndBytesConfig(
    load_in_4bit=True
)

# load the processor
processor = AutoProcessor.from_pretrained(
    'allenai/MolmoE-1B-0924',
    trust_remote_code=True,
    device_map='auto',
    torch_dtype="auto"
)

# load the model
model = AutoModelForCausalLM.from_pretrained(
    'allenai/MolmoE-1B-0924',
    trust_remote_code=True,
    offload_folder="offload",
    quantization_config=quant_config,
    torch_dtype="auto"
)
It is worthwhile to note that the model is a 7B one with 1B active parameters. So, even if only 1B parameters are used during the forward pass, with INT4 quantization, we need around at least 4.5GB of GPU memory to load the model and another 1.5GB to 2GB of GPU memory to run inference. All that said, this inference should run on a system with 8GB VRAM.
Helper Functions
We need a few helper functions to carry out the inference effectively. The first one is for drawing the keypoints according to the outputs from the model that we will get when carrying out pointing demos.
def draw_point_and_show(image_path=None, points=None):
    image = cv2.imread(image_path)
    h, w, _ = image.shape

    for point in points:
        p1 = int((point[0]/100)*w)
        p2 = int((point[1]/100)*h)
        image = cv2.circle(
            image,
            (p1, p2),
            radius=5,
            color=(0, 255, 0),
            thickness=5,
            lineType=cv2.LINE_AA
        )

    plt.imshow(image[..., ::-1])
    plt.axis('off')
    plt.show()
The draw_point_and_show function accepts an image path and the list of tuples containing the x, y coordinates.
We annotate the keypoints on the image by iterating through the list. One particular detail is the scaling of the points by first dividing them by 100 and then multiplying them with the image width or height. This is because the models return the keypoints to be easily read in an HTML page. In case you are curious, I got the solution from this discussion.
We also need another helper function to get the x, y coordinates from the model output.
def get_coords(output_string):
    if 'points' in output_string:
        # Handle multiple coordinates
        matches = re.findall(r'(xd+)="([d.]+)" (yd+)="([d.]+)"', output_string)
        coordinates = [(int(float(x_val)), int(float(y_val))) for _, x_val, _, y_val in matches]
    else:
        # Handle single coordinate
        match = re.search(r'x="([d.]+)" y="([d.]+)"', output_string)
        if match:
            coordinates = [(int(float(match.group(1))), int(float(match.group(2))))]

    return coordinates
When asked to point towards objects, the model outputs a string in the following format.
<point x="56.2" y="32.7" alt="dog">dog</point>
The above is not a custom data structure, but rather a string. So, we need the above function that employs regex to find all the coordinates. In case, the image contains multiple objects that we are asking it to point to, the output format is the following:
<points x1="26.0" y1="67.5" x2="44.2" y2="40.5" alt="people">people</points>
The final helper function runs the inference.
def get_output(image_path=None, prompt="Describe this image."):
    # process the image and text
    if image_path:
        inputs = processor.process(
            images=[Image.open(image_path)],
            text=prompt
        )
    else:
        inputs = processor.process(
            images=[Image.open(requests.get("https://picsum.photos/id/237/536/354", stream=True).raw)],
            text=prompt
        )

    # move inputs to the correct device and make a batch of size 1
    inputs = {k: v.to(model.device).unsqueeze(0) for k, v in inputs.items()}

    # generate output; maximum 200 new tokens; stop generation when <|endoftext|> is generated
    output = model.generate_from_batch(
        inputs,
        GenerationConfig(max_new_tokens=200, stop_strings="<|endoftext|>"),
        tokenizer=processor.tokenizer
    )

    # only get generated tokens; decode them to text
    generated_tokens = output[0,inputs['input_ids'].size(1):]
    generated_text = processor.tokenizer.decode(generated_tokens, skip_special_tokens=True)

    # print the generated text
    print(generated_text)
    return generated_text
The get_output function accepts an optional image path and a prompt. If we do not provide any image, then it downloads an image of a dog and describes it.
Finally, it prints the output and returns it as well.
Running Inference
First, let’s call the function without any parameters to run the inference with the default settings.
outputs = get_output()
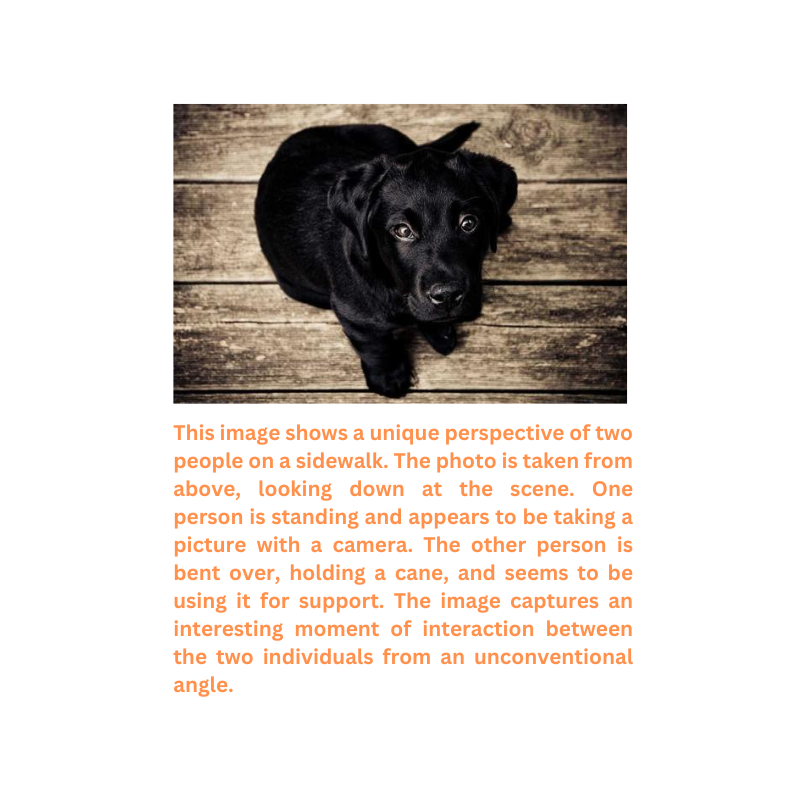
We have the following image and its corresponding description by the model.
The description is quite detailed. In fact, we can safely say that it is better than most other small VLMs out there.
Now, let’s ask the model to point out where the dog is.
outputs = get_output(prompt="Point where the dog is.")
In this case, we get the following output.
<point x="56.2" y="32.7" alt="dog">dog</point>
We need to pass this string through the get_coords function to get a list of tuples.
coords = get_coords(outputs)
print(coords)
The output from the function looks like the following:
[(56, 32)]
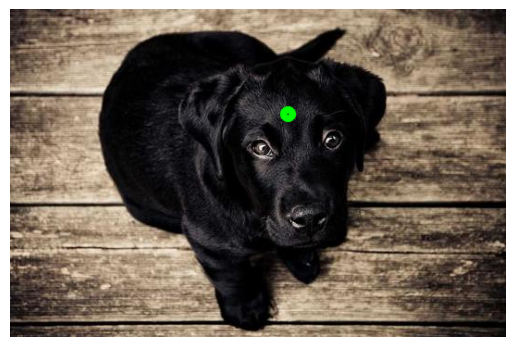
Now, we call the draw_point_and_show function while passing the image path and the above coordinates list.
draw_point_and_show('input/image_1.jpg', coords)
We get the following output.
This looks to the point.
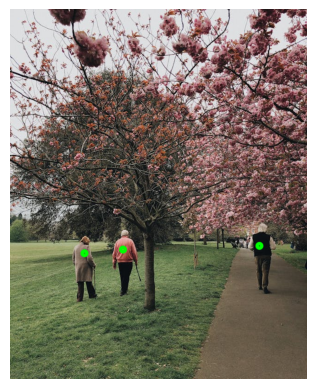
For one final experiment, let’s check whether it can point to all the people in an image.
outputs = get_output(image_path="input/image_3.jpg", prompt="Point to all the people")

coords = get_coords(outputs)
print(coords)

draw_point_and_show('input/image_3.jpg', coords)
We got the following output from the model.
<points x1="25.2" y1="66.8" x2="38.2" y2="65.2" x3="84.2" y3="64.6" alt="people">people</points>
The following is the image after annotating with the keypoints.
Looks like even the most efficient model can properly point to objects even if they are small. This opens a whole new world of possibilities with the Molmo family of models.
Taking the Capabilities Further
With the power of Molmo, especially, the pointing capabilities, now we can build a host of automated solutions. One of the most impressive ones is an automated pipeline to segment objects through natural language. Think about it, we tell the model, “point towards the red car” and the keypoint results go to a SAM2 model which automatically segments it. Combining this with a speech-to-text model will make the process entirely hands-free.
You can find a Molmo pointing + SAM2 demo on their official article site.
In fact, we will try to build a similar application in one of the future articles.
Summary and Conclusion
In this article, we covered the Molmo family of VLMs. Starting from the objective, the dataset curation, to the model demos, we covered it all. The demo section is a bit sparse because the capabilities are endless, and anyone can try it out easily, either locally, or on their site. The more we show here, the less it is. I hope this article was worth your time.
In case you have any doubts, thoughts, or suggestions, please leave them in the comment section. I will surely address them.
You can contact me using the Contact section. You can also find me on LinkedIn, and Twitter.
References
Source link
lol
