Deephaven’s v0.20 release brought an exciting new feature to the Deephaven Table API and UI: rollup tables.
A rollup table marries Deephaven’s combined aggregations with hierarchy. Let’s see how to recreate this rollup table.
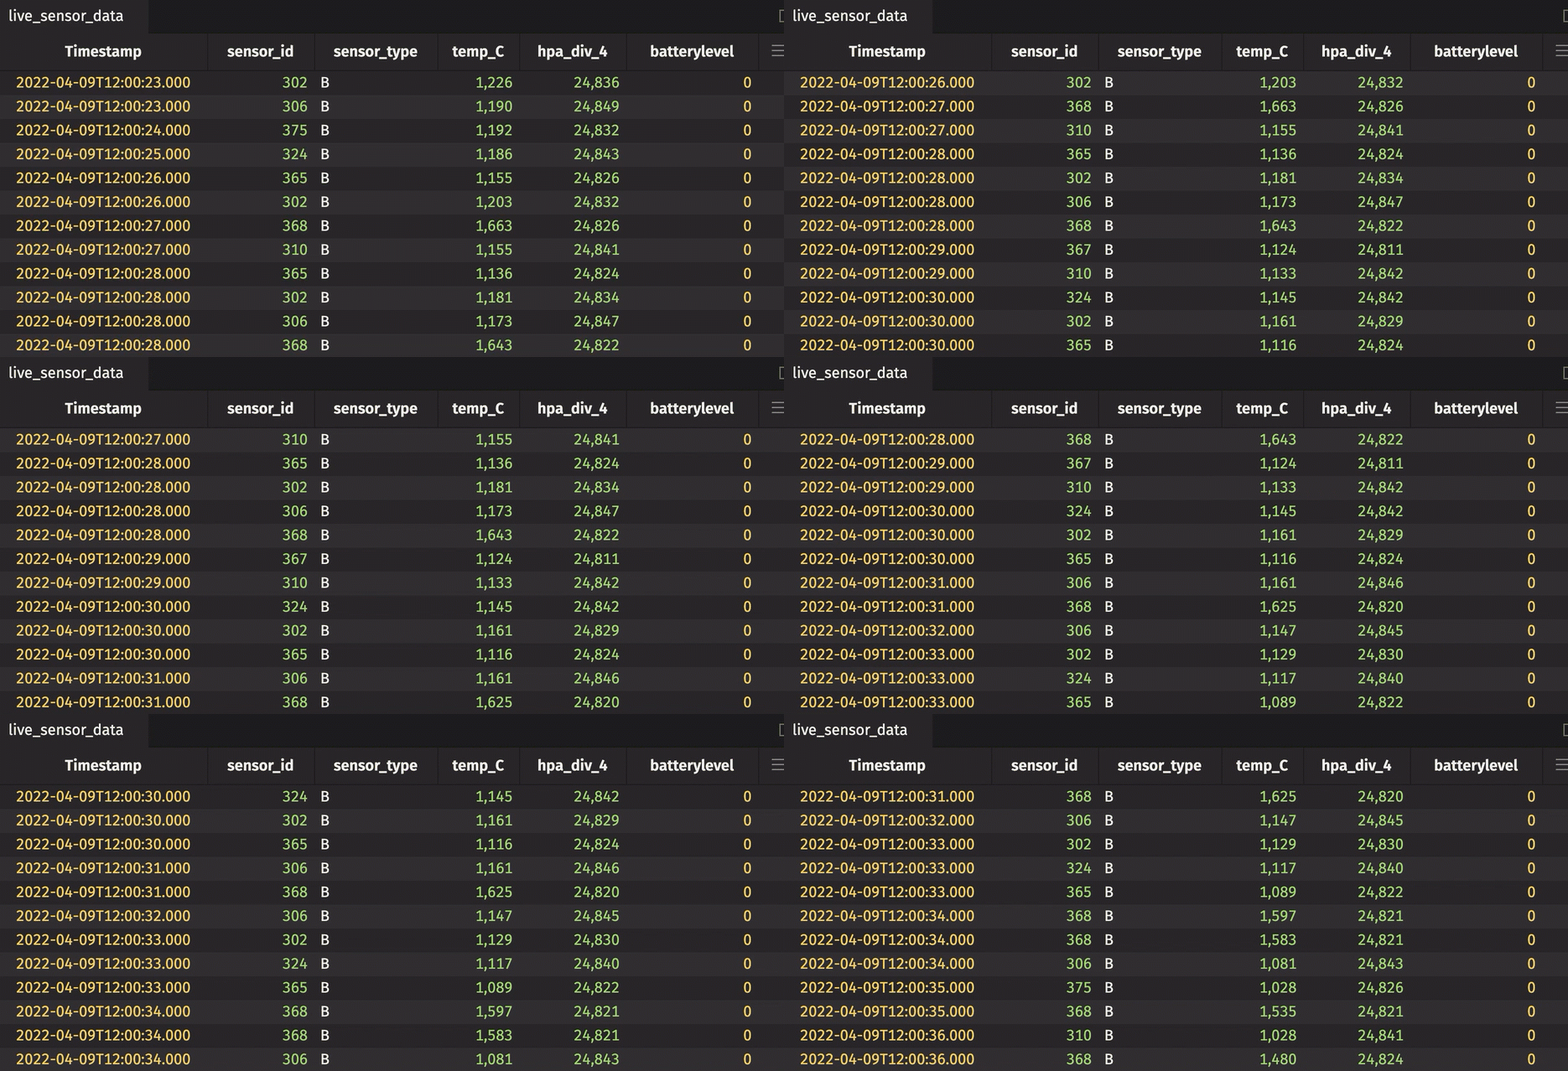
The dataset used in this example is found here. It contains sensor readings for 58 different sensors over approximately two weeks of time. The sensors measure pressure and temperature. The code below imports the dataset from CSV and replays it in real time using its Timestamp column.
from deephaven import TableReplayer
from deephaven import time as dhtu
from deephaven import read_csv

sensor_data = read_csv("https://media.githubusercontent.com/media/deephaven/examples/main/SensorData/csv/SensorData.csv")

start_time = dhtu.to_datetime("2022-04-09T12:00:00.000 NY")
end_time = dhtu.to_datetime("2022-04-23T10:28:36.000 NY")

replayer = TableReplayer(start_time, end_time)
live_sensor_data = replayer.add_table(sensor_data, "Timestamp")

replayer.start()

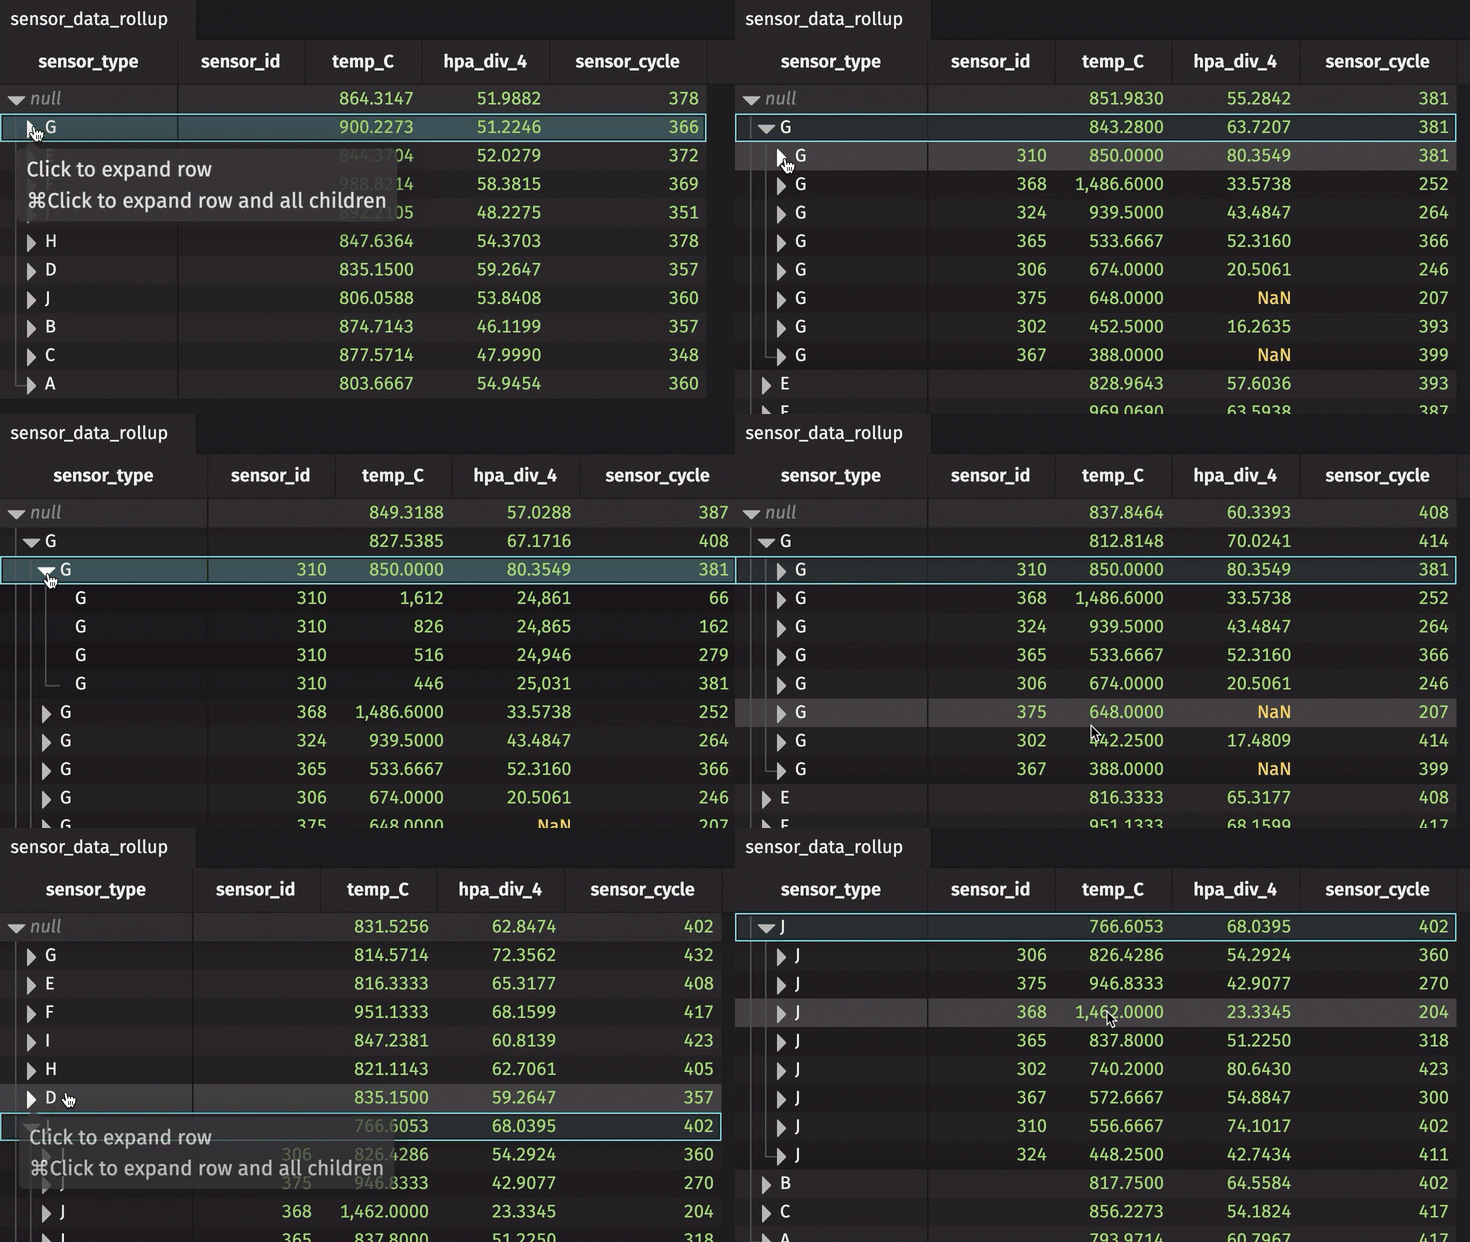
A rollup table calculates zero or more aggregations using Deephaven’s combined aggregations, and then splits the data into a hierarchical tree based on one or more columns in the bylist. The result looks like this.
from deephaven import agg

agg1 = agg.avg(cols=["temp_C"])
agg2 = agg.std(cols=["hpa_div_4"])
agg3 = agg.last(cols=["sensor_cycle"])

agglist = [agg1, agg2, agg3]
bylist = ["sensor_id"]

sensor_data_rollup = live_sensor_data.rollup(aggs=agglist, by=bylist, include_constituents=True)

The sensor_id can be expanded and collapsed using the UI. In its collapsed state, the table shows the average temperature in Celsius, standard deviation of pressure in hectopascals/4, and most recent sensor cycle number for the entire table. By expanding the sensor_id column, the calculations are performed for each unique sensor ID number. In the rollup operation, include_constituents is set to True, which allows for the additional expansion of each unique sensor ID number to show individual measurements.
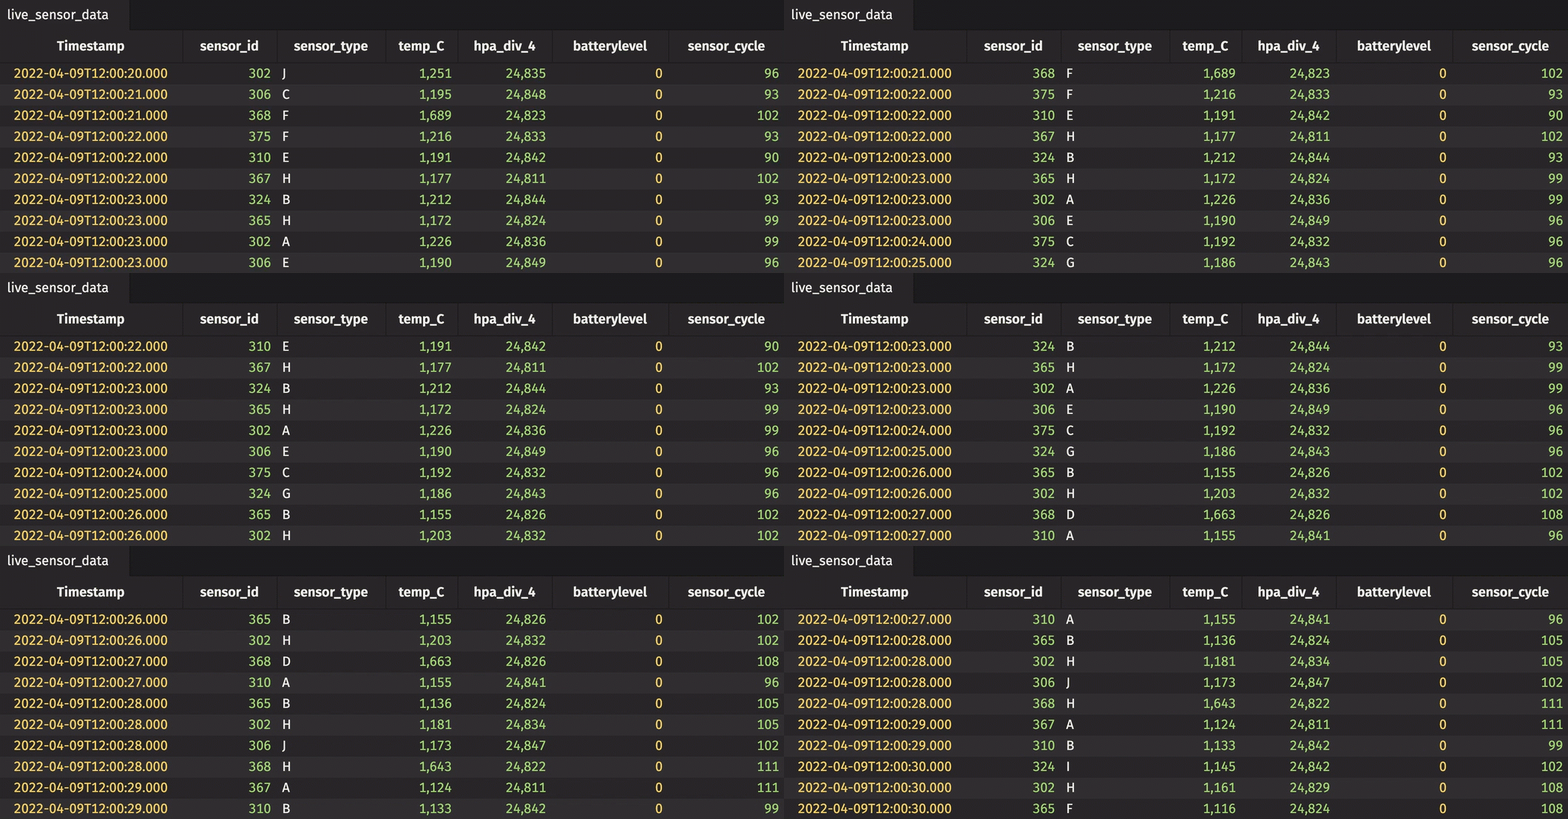
This is a simple example that demonstrates the utility of a rollup table, especially in real time, with a single rollup column. Hierarchy is not limited to just one column. The following code creates ten different sensor types labeled A through J and randomly assigns one to every measurement in the set.
import random, string

def get_random_letter() -> str:
    return str(random.choice(string.ascii_letters[:10])).upper()

sensor_data = sensor_data.drop_columns(["sensor_type"]).update_view(["sensor_type = get_random_letter()"])
The first query can be slightly modified to fit this new column of sensor types and create hierarchy from two columns.
Start by replaying the new sensor_data table.
from deephaven import TableReplayer
from deephaven import time as dhtu

start_time = dhtu.to_datetime("2022-04-09T12:00:00.000 NY")
end_time = dhtu.to_datetime("2022-04-23T10:28:36.000 NY")

replayer = TableReplayer(start_time, end_time)
live_sensor_data = replayer.add_table(sensor_data, "Timestamp")

replayer.start()

Then, create a new rollup table. This time, create a hierarchy from two columns.
from deephaven import agg

agg1 = agg.avg(cols=["temp_C"])
agg2 = agg.std(cols=["hpa_div_4"])
agg3 = agg.last(cols=["sensor_cycle"])

agglist = [agg1, agg2, agg3]
bylist = ["sensor_type", "sensor_id"]

sensor_data_rollup = live_sensor_data.rollup(aggs=agglist, by=bylist, include_constituents=True)

Now, each unique pair of sensor type and ID can be expanded and collapsed.
Rollup tables are a powerful tool in real-time analytics. Don’t take our word for it. Try it for yourself.
Our Slack community continues to grow. Join us!
Source link
lol

