What’s the problem?
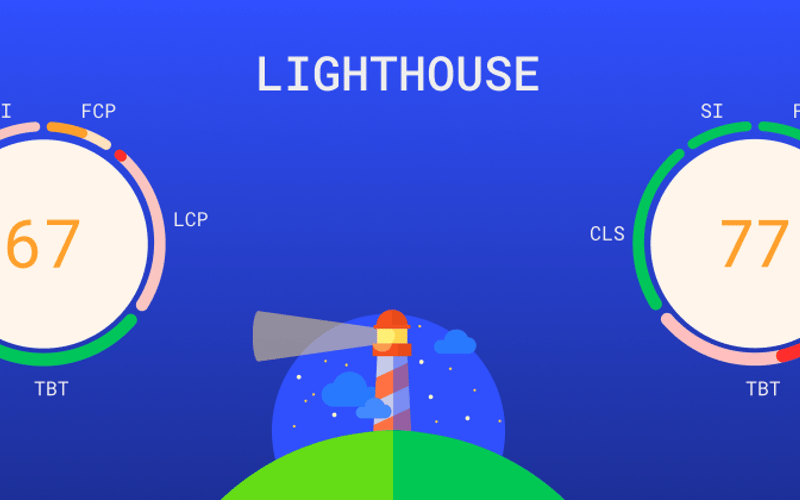
Have you ever run PageSpeed Insights (PSI) on your website only to receive a wildly different performance score than when running Lighthouse via Chrome Developer Tools? Let me show you what I mean:
The overall scores are relatively similar, but there is almost no correlation between the metrics that make them up. This is a problem because you cannot run PageSpeed Insights on your local build of the website, forcing you to publish any changes and test them online, which is slow, inconvenient, and a bad practice.
The reason for the discrepancy
PageSpeed uses Lighthouse under the hood, so what is the deal here? Googling this tells you that PageSpeed also includes some real-world data and so on, but this does not address the problem at stake. After some lengthy deep dives into the issue, we found the reason for it here:
PageSpeed Insights run Lighthouse using a relative 4x CPU slowdown.
The fact that it is relative results in a different score based on the device running the benchmark.
You might be tempted to say “just multiply the times here by X to compensate for having a faster computer.” However, this won’t work. We won’t go into the depths of why this is the case beyond saying that those metrics are complex and don’t scale in that way. You can find out more here (TBT is perhaps the simplest example of that).
Solution
Let us start by installing the tools we’ll need further down the line.
1. Install the Lighthouse CLI
You cannot tweak the CPU slowdown of a Lighthouse simulation through the Chrome Dev Tools. Hence the need for Lighthouse CLI. You can install it using
npm install -g lighthouse
2. Estimate the slowdown factor (optional)
Here we will show how to extract the benchmarkIndex for your device and then calculate an approximate slowdown factor that you need to use. This is the procedure found in the Chrome documentation. However, you will probably need to readjust the slowdown even after that. Therefore, we prefer to skip this step and find a suitable constant using trial and error.
2.1 Extract benchmarkIndex from the report
Here is a command that extracts the benchmarkIndex from the report. It presumes that you have jq installed on your system.
lighthouse YOUR_WEBSITE_URL --output=json --chrome-flags="--headless" --form-factor=mobile | jq '.environment.benchmarkIndex'
On a baseline 2021 M1 MacBook Pro, this number is around 2900.
2.2 Convert benchmarkIndex into a slowdown estimate
You can use the CPU Throttling Calculator to estimate the slowdown factor you need. For benchmarkIndex 2900, this yields 9.9. However, it later turns out that this is not enough by almost a factor of two.
Let’s take a look at why this might be the case. By reverse engineering the website code, we found that this calculator uses a linear estimation based on a few calibrated points. Let’s take a look at a chart of their estimation function:
The last calibrated point is around benchmark index 1300, more than two times lower than what a modern laptop is capable of. This explains why the estimated CPU slowdown of around 10 does not produce satisfactory results. In other words, it is not (yet) calibrated in the range that matters to us.
For a baseline 2021 M1 MacBook Pro, the slowdown factor that produces reasonable results sits around 19.
3. Run Lighthouse
You can run Lighthouse with a desired CPU slowdown like this:
lighthouse YOUR_WEBSITE_URL --throttling.cpuSlowdownMultiplier YOUT_CPU_SLOWDOWN --output=html --chrome-flags="--headless" --form-factor=mobile --output-path report.html
and then open up the generated HTML report.
This produces somewhat more relevant results:
The values are not the same, but we should not expect them to be — this is a complex benchmark running on a simulated device, after all. Go ahead and tweak your slowdown factor until it resembles what online PageSpeed Index test is telling you.
Here is a one-liner using a JSON report that also extracts the metrics in question:
lighthouse YOUR_WEBSITE_URL --throttling.cpuSlowdownMultiplier YOUT_CPU_SLOWDOWN --output=json --chrome-flags="--headless" --form-factor=mobile | jq -r '{LCP: .audits["largest-contentful-paint"].numericValue, "LCP Score": .audits["largest-contentful-paint"].score, FCP: .audits["first-contentful-paint"].numericValue, "FCP Score": .audits["first-contentful-paint"].score, SI: .audits["speed-index"].numericValue, "SI Score": .audits["speed-index"].score, TBT: .audits["total-blocking-time"].numericValue, "TBT Score": .audits["total-blocking-time"].score, CLS: .audits["cumulative-layout-shift"].numericValue, "CLS Score": .audits["cumulative-layout-shift"].score, "TOTAL": .categories.performance.score} | to_entries[] | "(.key): (.value)"'
It is not the prettiest, but it can be useful.
4. Repeat multiple times
The last thing we wanted to touch on is repeatability. Lighthouse will produce vastly different performance results each run. Therefore, we usually like to run it at least 5 times and compute the averages. This allows us to have a better sense of whether we are moving in the right direction.
The gist here contains a script that does just that for you.
5. Dive deeper
The Lighthouse JSON report contains much more information that the HTML one, so it is worth examining a bit. It contains all the reasons why the webpage might not be performing well. One of the more useful things we found is the largest-contentful-paint-element, which tells you which element you should optimize in order to achieve a better LCP score.
Let’s get back to work
Well, now the hard part begins – improving the webpage performance. However, do not forget that Lighthouse is a (very relevant) made-up metric – in reality, you need to optimize your webpage for real-world users. And web crawlers, but we will get into the SEO debate some other time.
This blog post was written by the awesome team at zerodays.dev.
Source link
lol


