Time series play a crucial role in Data Science, especially when analyzing financial data. The price variations of cryptocurrencies like Bitcoin and Ethereum offer an excellent opportunity to explore time series. In this article, we will analyze the price variations of Bitcoin and Ethereum in euros, using datasets ranging from 2012 to 2019 for Bitcoin and from 2015 to 2019 for Ethereum. We will also illustrate the use of some basic time series techniques with concrete examples and practical recommendations.
Importing Libraries and Loading Data
Before diving into the analysis, we need to import the necessary libraries and load the datasets.
import numpy as np
import matplotlib.pyplot as plt
import pandas as pd

# Loading Bitcoin data
btc = pd.read_csv("BTC-EUR.csv", index_col="Date", parse_dates=True)
btc.head()
Data Exploration
Let’s take a look at the first few rows of the data to get an idea of its structure.
btc.head()
This allows us to verify that the data has been correctly loaded and that date indexing has been successfully applied.
Weekly Variation Analysis
Now, let’s analyze the weekly variations of Bitcoin’s closing prices.
btc['Close'].resample('W').agg(['mean', 'std'])
Recommendation: Resampling is a powerful technique to summarize data at different frequencies (daily, weekly, monthly, etc.). It helps to reveal hidden trends and patterns.
Data Visualization
Visualizing data is crucial to understand trends and anomalies. Let’s start by plotting Bitcoin’s closing prices.
btc['Close'].plot(figsize=(9, 6))
The first time I plotted financial data, I was surprised at how much detail can be hidden in a simple curve.
Specific Period Data Analysis
We can also focus on specific periods for more detailed analysis.
btc['2019']['Close'].plot(figsize=(9, 6))
And for an even shorter period:
btc['2019-09']['Close'].plot(figsize=(9, 6))
Comparison of Monthly and Weekly Averages
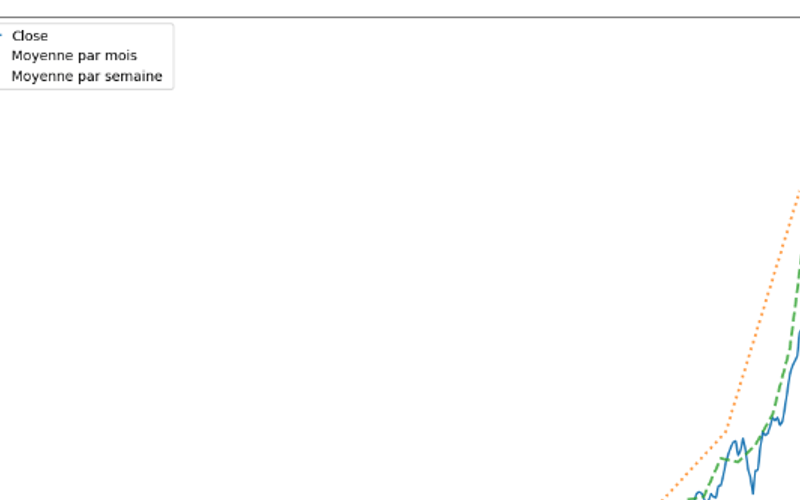
For deeper analysis, let’s compare the monthly and weekly averages of closing prices for the year 2017.
plt.figure(figsize=(12, 9))
btc['2017']['Close'].plot()
btc.loc['2017','Close'].resample("M").mean().plot(label="Moyenne par mois ", lw=2, ls=":", alpha=0.8)
btc.loc['2017', 'Close'].resample("W").mean().plot(label="Moyenne par semaine ", lw=2, ls="--", alpha=0.8)
plt.legend()
Recommendation: Comparing averages at different frequencies can reveal seasonal trends or economic cycles.
Ethereum Analysis
Now, let’s analyze the Ethereum data.
eth = pd.read_csv('ETH-EUR.csv', index_col="Date", parse_dates=True)
eth.head()
Merging Bitcoin and Ethereum Data
For comparative analysis, we will merge the Bitcoin and Ethereum data.
btc_eth = pd.merge(btc, eth, how='inner', on='Date', suffixes=('_btc', '_eth'))
btc_eth.head()
Comparative Visualization of Variations
Finally, let’s visualize the variations of both cryptocurrencies.
btc_eth[['Close_btc', 'Close_eth']].plot(figsize=(12, 8), subplots=True)
plt.show()
Comparing data from different cryptocurrencies can give us insight into their relative behavior and correlation.
Time series analysis is an indispensable tool in Data Science, particularly for financial data. By using resampling, visualization, and comparison techniques, we can uncover trends and patterns hidden in the data. Cryptocurrencies, with their volatility and growing popularity, offer an ideal learning ground for these techniques.
Source link
lol


